Free Access
Fig. 4
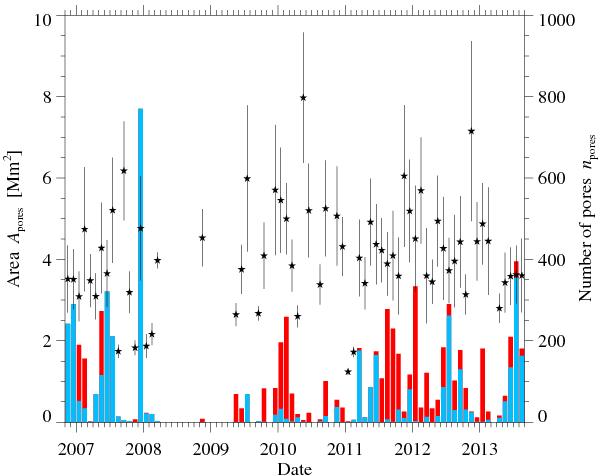
Mean area of pores (“★” symbols) for each month derived from single G-band images. The vertical lines represent 1/5 of the standard deviation of the monthly distributions. The red and blue bars correspond to the number of pores per month (right scale) in the northern and southern hemispheres, respectively.
Current usage metrics show cumulative count of Article Views (full-text article views including HTML views, PDF and ePub downloads, according to the available data) and Abstracts Views on Vision4Press platform.
Data correspond to usage on the plateform after 2015. The current usage metrics is available 48-96 hours after online publication and is updated daily on week days.
Initial download of the metrics may take a while.