Fig. 13
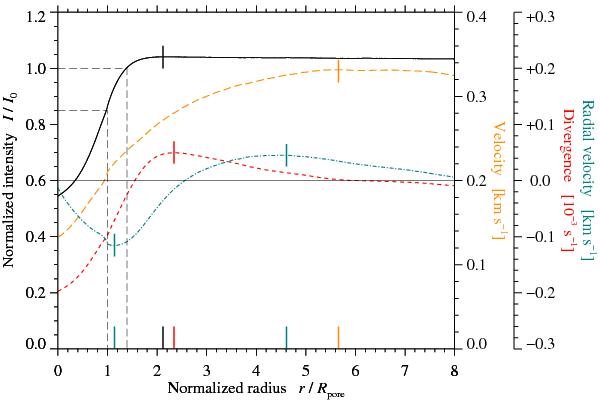
Azimuthally averaged profiles of intensity (solid), flow velocity (long-dashed), divergence (dashed), and radial velocity (dash-dotted) for all pores (same as Fig. 11 using a similar layout to the one in Fig. 8). Two dashed lines represent our choice of intensity threshold (0.85 I0) and the photometric radius of pores (1.0 I0). The solid line in the center is provided as a visual guide for the zero-crossing of divergence and radial velocity. The short colored vertical lines mark the extreme values and zero-crossings. These markers are replicated on the abscissa to assist in finding the corresponding normalized radii.
Current usage metrics show cumulative count of Article Views (full-text article views including HTML views, PDF and ePub downloads, according to the available data) and Abstracts Views on Vision4Press platform.
Data correspond to usage on the plateform after 2015. The current usage metrics is available 48-96 hours after online publication and is updated daily on week days.
Initial download of the metrics may take a while.