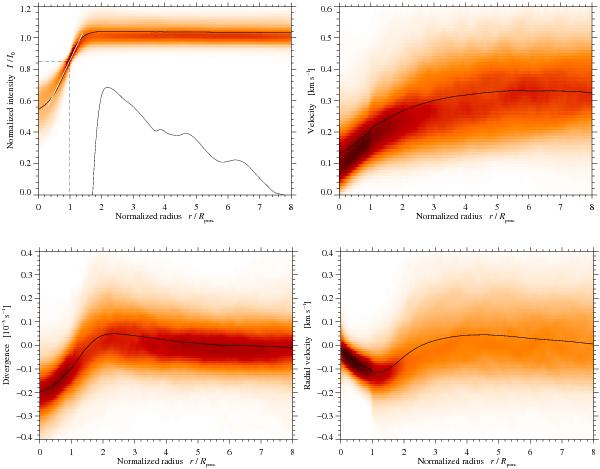
Fig. 12

Azimuthally averaged profiles for intensity (top-left), flow velocity (top-right), divergence (bottom-left), and radial velocity (bottom-right) for all pores. The profiles are computed for normalized radial distances, where r/Rpore = 0 and r/Rpore = 1 indicate the center and the boundary of the pores, respectively. The frequency of occurrence is shown as a shaded background, where darker regions refer to more commonly encountered values. In the intensity profile (top-left), the solid curve represents the percentage of increase in average intensity, and the dashed line reflects our choice of the intensity threshold (0.85 I0) delimiting pores. The white line corresponds to an intensity gradient of  .
.
Current usage metrics show cumulative count of Article Views (full-text article views including HTML views, PDF and ePub downloads, according to the available data) and Abstracts Views on Vision4Press platform.
Data correspond to usage on the plateform after 2015. The current usage metrics is available 48-96 hours after online publication and is updated daily on week days.
Initial download of the metrics may take a while.


