Free Access
Fig. 11
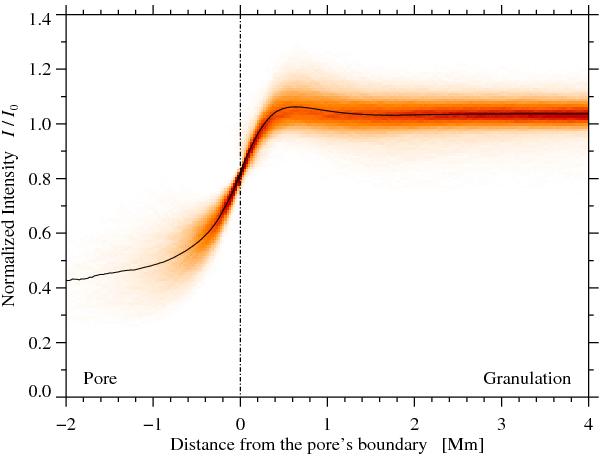
Typical intensity profile of a pore based on single G-band images after azimuthal averaging. The vertical dash-dotted line indicates the boundary of the pore corresponding to the intensity threshold of 0.85 I0. The background image shows the two-dimensional frequency distribution of the intensities.
Current usage metrics show cumulative count of Article Views (full-text article views including HTML views, PDF and ePub downloads, according to the available data) and Abstracts Views on Vision4Press platform.
Data correspond to usage on the plateform after 2015. The current usage metrics is available 48-96 hours after online publication and is updated daily on week days.
Initial download of the metrics may take a while.