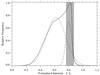
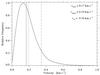
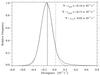
Fig. 10
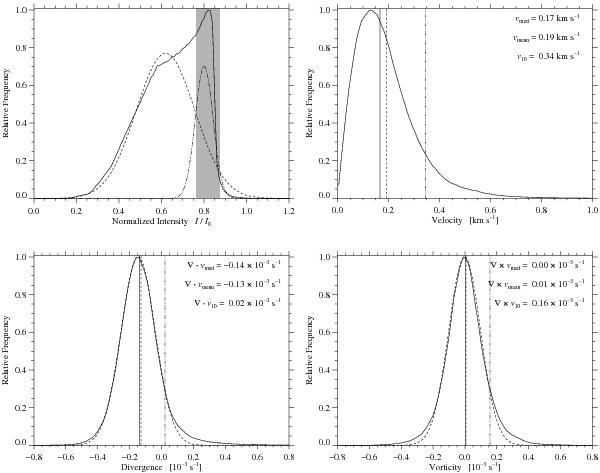
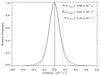
The intensity distribution (top-left) of all pores (solid) can be fitted with two Gaussians, i.e., a dark component with μ1 = 0.62 I0 and σ1 = 0.14 I0 (dashed) and a bright component with μ2 = 0.80 I0 and σ2 = 0.04 I0 (dash-dotted). The gray region outlines the bright component as given by the optimal thresholds T1 = 0.76 I0 and T2 = 0.87 I0. The frequency distributions are also given for the flow speed (top-right), the divergence (bottom-left), and the vorticity (bottom-right) within all pores. The three vertical lines mark the position of the median (solid), mean (long-dashed), and 10th percentile (dash-dotted) of the the speed v, the divergence ∇ ·v, and the vorticity ∇ × v. The divergence and vorticity distributions are fitted with a Gaussian (dashed) having a mean value of μ = −0.14 × 10⁻³ s-1 and −0.01 × 10⁻³ s-1, respectively.
Current usage metrics show cumulative count of Article Views (full-text article views including HTML views, PDF and ePub downloads, according to the available data) and Abstracts Views on Vision4Press platform.
Data correspond to usage on the plateform after 2015. The current usage metrics is available 48-96 hours after online publication and is updated daily on week days.
Initial download of the metrics may take a while.