Fig. 1
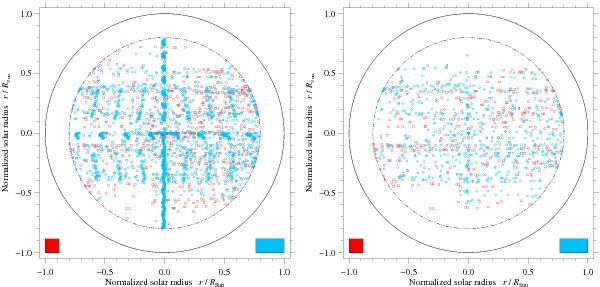
Distribution of all 4530 selected single G-band images on the solar disk in the period from 2006 October 25 to 2013 August 31 (left). Diamonds and squares indicate single G-band images with 2048 × 1024 (3819 images) and 1024 × 1024 (711 images) pixels, respectively. Distribution of all 1013 G-band images (690 images with 2048 × 1024 and 323 images with 1024 × 1024 pixels) with pores on the solar disk (right). The different image sizes are indicated by the filled boxes in the lower left and right corners. The solid line encircles the solar disk, and the dash-dotted line refers to μ = cosθ = 0.6.
Current usage metrics show cumulative count of Article Views (full-text article views including HTML views, PDF and ePub downloads, according to the available data) and Abstracts Views on Vision4Press platform.
Data correspond to usage on the plateform after 2015. The current usage metrics is available 48-96 hours after online publication and is updated daily on week days.
Initial download of the metrics may take a while.