Fig. 8
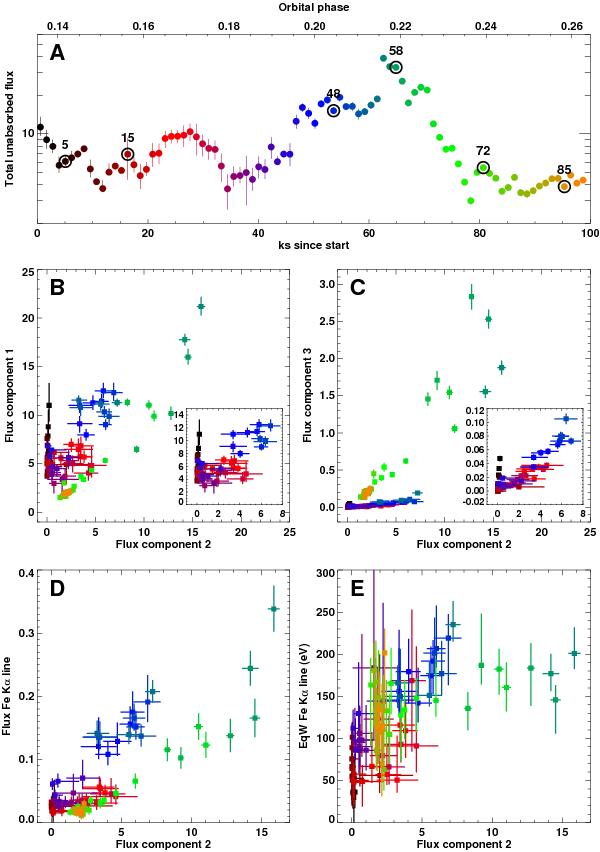
A) 0.6−10 keV unabsorbed flux light curve with a binning time of 1.1 ks. Marked circles indicate the data points corresponding to the spectra shown in Figs. 5 and 6. B) Flux of the first component versus that of the second component. The inset shows an enlarged view of the first 58 ks, before the onset of the giant flare. C) Flux of the third component versus that of the second component with an inset equivalent to that in B). D) Fe Kα fluorescence line flux areas against normalization factor of second component. E) Fe Kα equivalent width against the normalization factor of the second component. All fluxes are in units of 10-9 erg cm-2 s-1.
Current usage metrics show cumulative count of Article Views (full-text article views including HTML views, PDF and ePub downloads, according to the available data) and Abstracts Views on Vision4Press platform.
Data correspond to usage on the plateform after 2015. The current usage metrics is available 48-96 hours after online publication and is updated daily on week days.
Initial download of the metrics may take a while.