Fig. 7
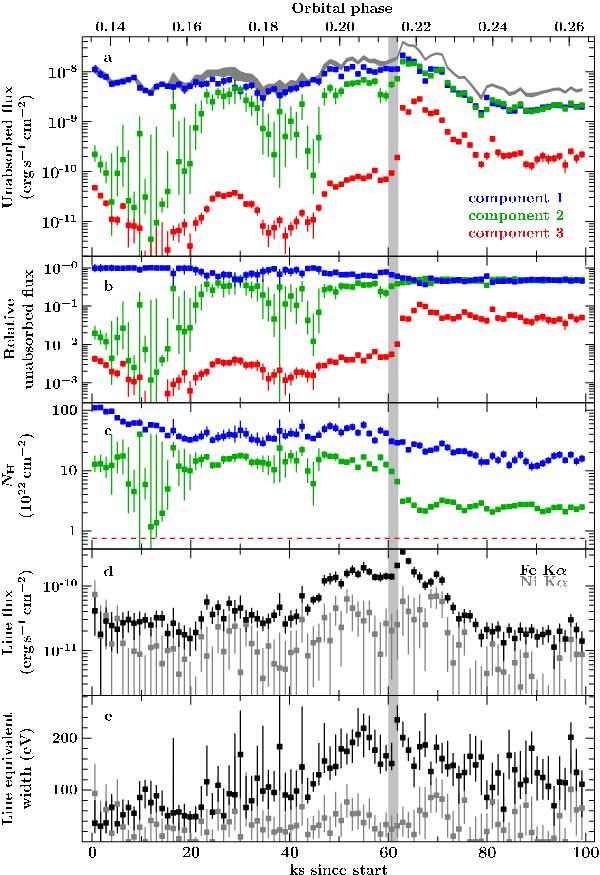
From top to the bottom: evolution of the model parameters versus time and orbital phase. Error bars are 90% confidence level. The dashed line in panel c) indicates the constant NH of component 3. The grey column marks the rise of the flare and the grey curve in panel a) shows the overall unabsorbed flux of the spectral model.
Current usage metrics show cumulative count of Article Views (full-text article views including HTML views, PDF and ePub downloads, according to the available data) and Abstracts Views on Vision4Press platform.
Data correspond to usage on the plateform after 2015. The current usage metrics is available 48-96 hours after online publication and is updated daily on week days.
Initial download of the metrics may take a while.