Fig. 4
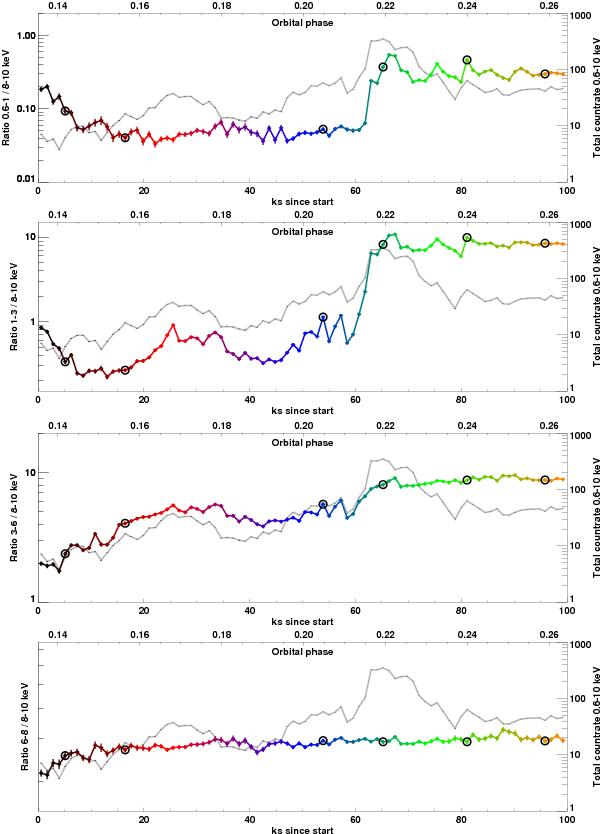
Ratios between count rates in different energy bands to that of the 8–10 keV band. From top to bottom: 0.6–1 keV, 1–3 keV, 3–6 keV, and 6–8 keV. The time binning is 1128 s (~4 pulse periods), matching the spectra used in the time-resolved spectral analysis. In the background, the total flux evolution is plotted for comparison with the light curves. Circles mark the data points corresponding to the spectra shown in Fig. 5.
Current usage metrics show cumulative count of Article Views (full-text article views including HTML views, PDF and ePub downloads, according to the available data) and Abstracts Views on Vision4Press platform.
Data correspond to usage on the plateform after 2015. The current usage metrics is available 48-96 hours after online publication and is updated daily on week days.
Initial download of the metrics may take a while.