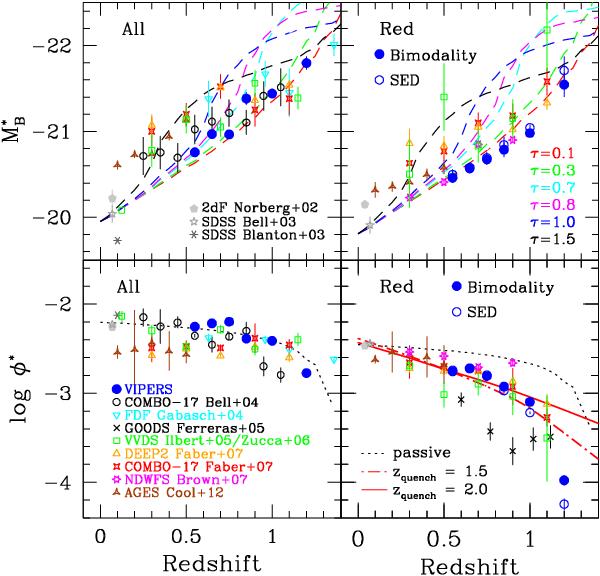
Fig. 16

Evolution in  (top panels) and in
φ∗ (bottom panels)
as a function of redshift for the VIPERS sample (left), and for red
galaxies only (right). Various literature data are shown for
comparison. For the red LF, galaxies were divided into red and blue as defined using
the colour-bimodality scheme (filled symbols) and according to their SED type
classification (open symbols). In the top panels, the dashed lines
indicate the evolution in
  as predicted by the PEGASE models,
calibrated on local SDSS data, with various burst duration time scales
τ. In
the bottom right panel the red lines give the predictions of
quenching models with quenching formation times of zquench = 1.5 (dot-dashed) and
zquench = 2.0 (solid), which are in
very good agreement with the VIPERS data. The dotted line in the bottom
panels gives the PEGASE prediction of a passive evolution model for the
evolution of the number density.
Current usage metrics show cumulative count of Article Views (full-text article views including HTML views, PDF and ePub downloads, according to the available data) and Abstracts Views on Vision4Press platform.
Data correspond to usage on the plateform after 2015. The current usage metrics is available 48-96 hours after online publication and is updated daily on week days.
Initial download of the metrics may take a while.


