Fig. 7
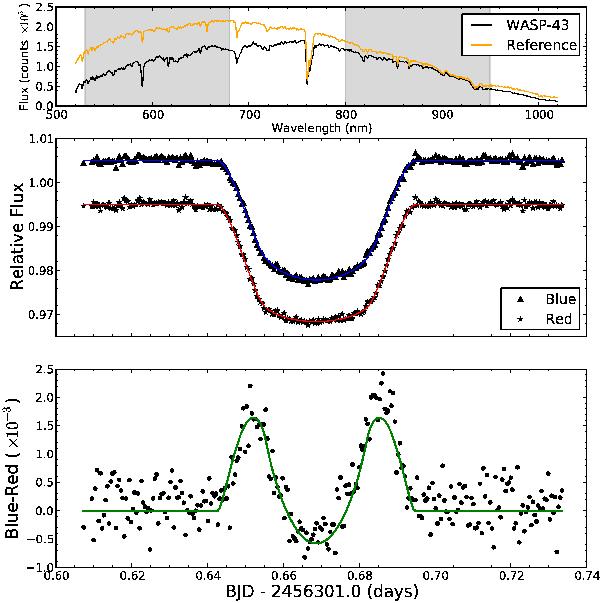
Color signature of WASP-43. Top panel: spectrum of WASP-43 and reference star showing the regions where the blue and red filters were defined (gray area). Middle panel: blue and red light curves after correcting for systematic effects and best model fit. Bottom panel: color (blue-red) showing the color signature of WASP-43, the green line represents the difference of the fitted models for the blue and red filters.
Current usage metrics show cumulative count of Article Views (full-text article views including HTML views, PDF and ePub downloads, according to the available data) and Abstracts Views on Vision4Press platform.
Data correspond to usage on the plateform after 2015. The current usage metrics is available 48-96 hours after online publication and is updated daily on week days.
Initial download of the metrics may take a while.