Free Access
Fig. 6
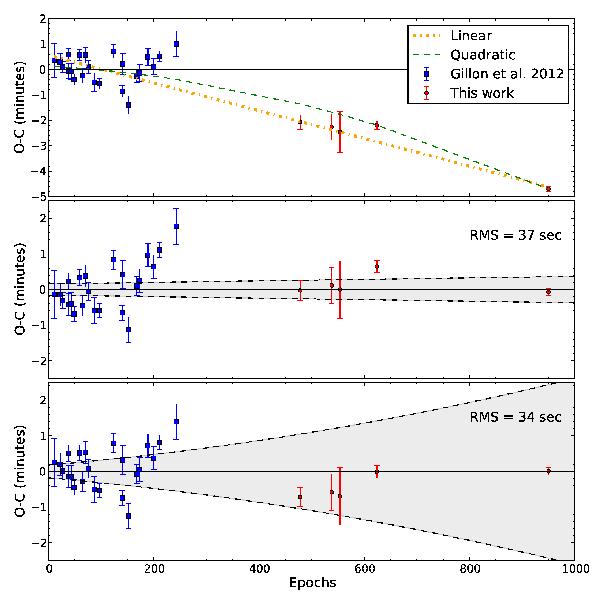
Top panel: O–C diagram and linear and quadratic fits for GTC, Gillon et al. (2012) transits of WASP-43b. Middle panel: residuals of the linear fit to the data and 1σ uncertainties of fit (gray area). Bottom panel: residuals of the quadratic fit to the data and 1σ uncertainties of fit (gray area).
Current usage metrics show cumulative count of Article Views (full-text article views including HTML views, PDF and ePub downloads, according to the available data) and Abstracts Views on Vision4Press platform.
Data correspond to usage on the plateform after 2015. The current usage metrics is available 48-96 hours after online publication and is updated daily on week days.
Initial download of the metrics may take a while.