Free Access
Fig. 2
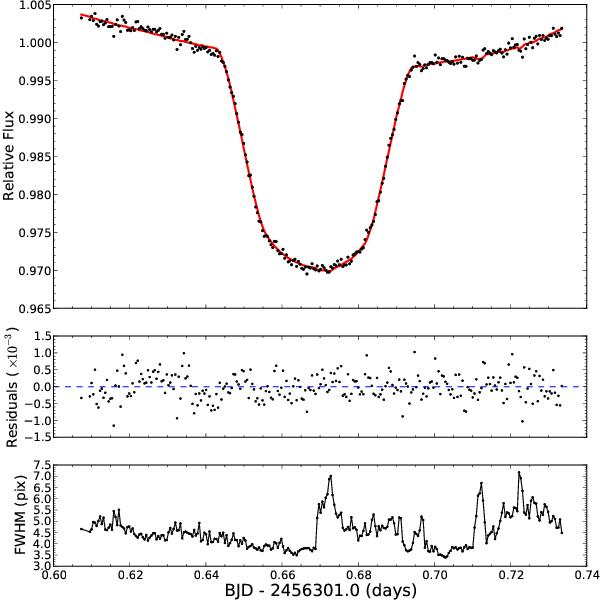
Top panel: GTC/OSIRIS WASP-43b transit white light curve. The red line represents the best fit determined using our MCMC analysis. Middle panel: residuals of the fit. Bottom panel: full width at half maximum (FWHM) of WASP-43 in the spatial direction versus time, showing the seeing variations during the observations.
Current usage metrics show cumulative count of Article Views (full-text article views including HTML views, PDF and ePub downloads, according to the available data) and Abstracts Views on Vision4Press platform.
Data correspond to usage on the plateform after 2015. The current usage metrics is available 48-96 hours after online publication and is updated daily on week days.
Initial download of the metrics may take a while.