Fig. A.4
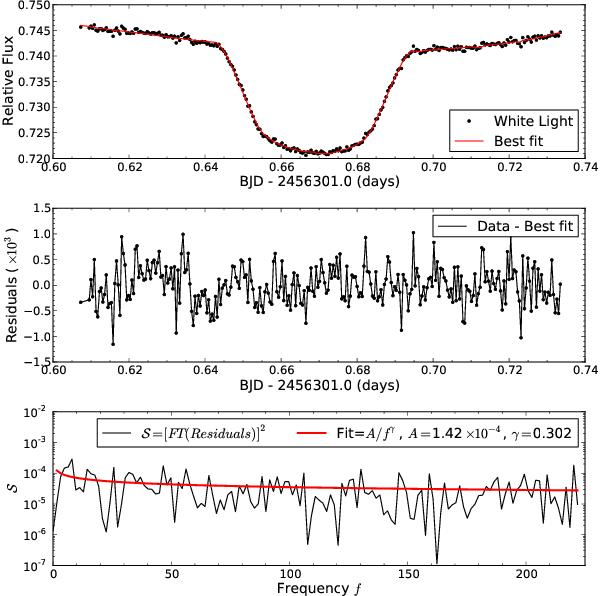
Red noise analysis. Top panel: white light curve of WASP-43b and best fit. Middle panel: residuals of the white light curve (curve after subtracting the best fit). Bottom panel: square of the Fourier transform of the residuals. A fit of the form A/fγ yields an exponent value of γ = 0.302; according to Carter & Winn (2009) this means that the major noise source in this curve is white noise.
Current usage metrics show cumulative count of Article Views (full-text article views including HTML views, PDF and ePub downloads, according to the available data) and Abstracts Views on Vision4Press platform.
Data correspond to usage on the plateform after 2015. The current usage metrics is available 48-96 hours after online publication and is updated daily on week days.
Initial download of the metrics may take a while.