Free Access
Fig. 11
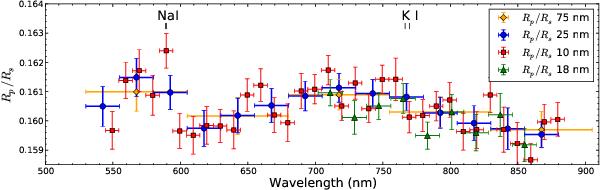
Transmission spectrum of WASP-43b showing all the wavelength bins used in this study. The horizontal bars represent the wavelength width of the filters, the vertical error bars show the 1σ uncertainties found by the MCMC procedure after multiplying by the β factors to take into account the red noise.
Current usage metrics show cumulative count of Article Views (full-text article views including HTML views, PDF and ePub downloads, according to the available data) and Abstracts Views on Vision4Press platform.
Data correspond to usage on the plateform after 2015. The current usage metrics is available 48-96 hours after online publication and is updated daily on week days.
Initial download of the metrics may take a while.