Free Access
Fig. 1
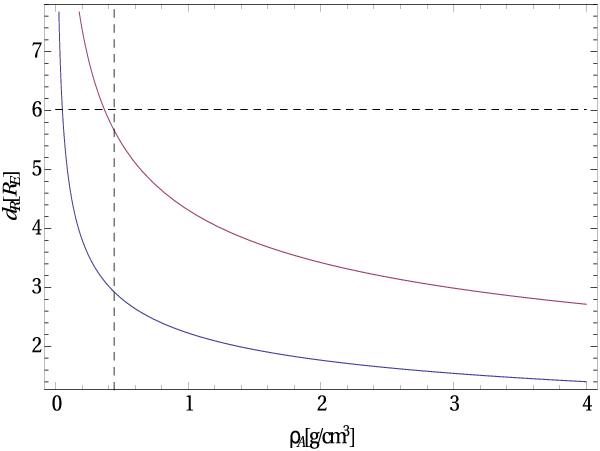
Roche limit of Apophis as a function of its bulk density: the blue line corresponds to the rigid case, and the red curve to the fluid case. The dashed lines correspond to the minimum flyby distance.
Current usage metrics show cumulative count of Article Views (full-text article views including HTML views, PDF and ePub downloads, according to the available data) and Abstracts Views on Vision4Press platform.
Data correspond to usage on the plateform after 2015. The current usage metrics is available 48-96 hours after online publication and is updated daily on week days.
Initial download of the metrics may take a while.