Fig. 9
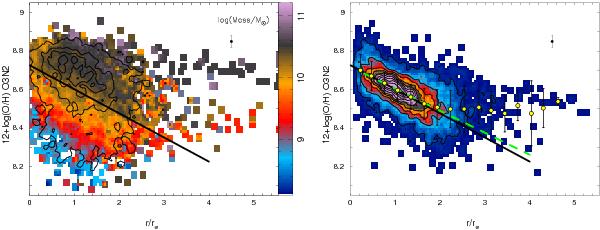
Left panel: radial distribution for the oxygen abundance derived using the O3N2 indicator for all the galaxies in our sample. The contours show the density distribution of H ii regions in this parameter space. The outermost contour encircles 95% of the total number of H ii regions, with ~20% less in each consecutive contour. The color image shows the average stellar mass of each galaxy corresponding to each abundance and radial distance. Right panel: radial distribution for the oxygen abundance derived using the O3N2 indicator, after scaling to the average value at the disk effective radius for each galaxy. The image and contours show the density distribution of H ii regions in this parameter space. The outermost contour encircles 95% of the total number of H ii regions, with ~20% less in each consecutive contour. The solid yellow points represent the average oxygen abundances, with their corresponding standard deviations indicated as error bars for consecutive bins of 0.3 galactocentric distances per disk effective radius. The average error of the derived oxygen abundance (without considering systematic errors) is shown by a single error bar located on the top-right side of the panel. The dashed green line shows the result of the best linear regression to the data. The solid black lines in both panels represent the linear relation corresponding to the mean values of the zero points and slopes of the individual regressions derived for distribution of each individual galaxy.
Current usage metrics show cumulative count of Article Views (full-text article views including HTML views, PDF and ePub downloads, according to the available data) and Abstracts Views on Vision4Press platform.
Data correspond to usage on the plateform after 2015. The current usage metrics is available 48-96 hours after online publication and is updated daily on week days.
Initial download of the metrics may take a while.