Fig. 5
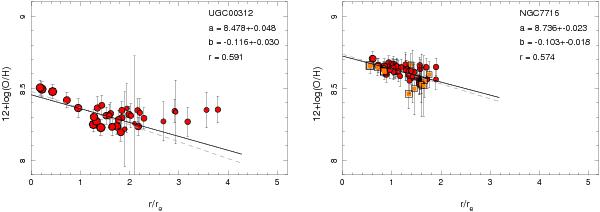
Radial distribution of the oxygen abundance derived for the individual H ii regions with abundance errors below 0.15 dex, as a function of the deprojected galactocentric distance (i.e., corrected for inclination), normalized to the disk effective radius, for the galaxies presented in Fig. 2. The size of the symbols is proportional to the Hα intensity. The red circles represent those H ii regions below the Kauffmann et al. (2003) line, and the orange squares represent those above this curve and below the Kewley et al. (2001) demarcation lines, i.e., the regions in the so-called intermediate zone in the BPT diagram. The solid and dashed lines show the best linear regression and error-weighted linear fit derived for those values between 0.3 and 2.1 re. The results from the second fit are shown in the figure, including the zero point (a), slope (b), and correlation coefficient (r).
Current usage metrics show cumulative count of Article Views (full-text article views including HTML views, PDF and ePub downloads, according to the available data) and Abstracts Views on Vision4Press platform.
Data correspond to usage on the plateform after 2015. The current usage metrics is available 48-96 hours after online publication and is updated daily on week days.
Initial download of the metrics may take a while.