Fig. 3
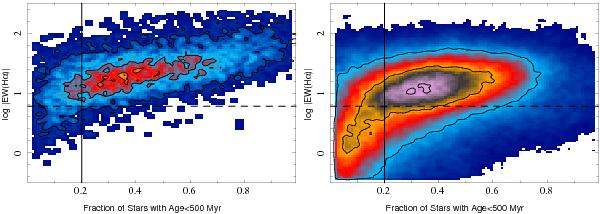
Left panel: absolute value of the equivalent width of Hα, on a logarithmic scale, plotted against the portion of young stars in the underlying stellar population (according to the SSP modeling by FIT3D ) for the clumpy ionized regions selected with HIIexplorer. Right panel: similar distribution of the emission equivalent width of Hα, on a logarithmic scale, as a function of the luminosity portion of young stars in the underlying stellar population for the ~500 000 individual spaxels with Hα emission detected in the 306 analyzed datacubes. In both panels, the dashed horizontal line shows the demarcation limit of the EW of Hα proposed by Cid Fernandes et al. (2010) to distinguish between strong (star formation and/or AGNs) and weak (e.g., post-AGBs) ionization sources. The vertical solid line shows the currently adopted selection criteria for the H ii regions.
Current usage metrics show cumulative count of Article Views (full-text article views including HTML views, PDF and ePub downloads, according to the available data) and Abstracts Views on Vision4Press platform.
Data correspond to usage on the plateform after 2015. The current usage metrics is available 48-96 hours after online publication and is updated daily on week days.
Initial download of the metrics may take a while.