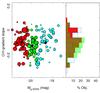
Fig. A.3
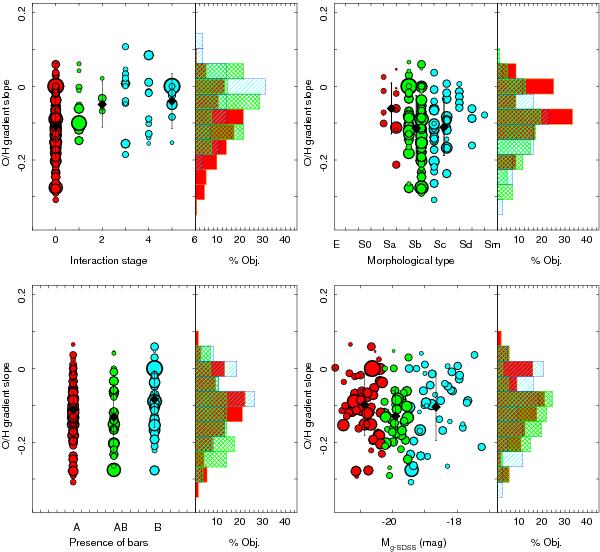
Top-left panel: distribution of the slopes of the abundance gradients as a function of the interaction stage of the galaxies, when the galactocentric distances are normalized to the effective radius derived by a growth curve analysis. The colors of the symbols and the corresponding histograms indicate three types of galaxies based on the interaction: (i) no signatures of interaction (red); (ii) galaxies with close companions and/or in an early interaction stage (green); and (iii) galaxies under clear collision or evolved mergers (blue). Top-right panel: similar distribution of slopes as a function of the morphological classification of the galaxies. The colors of the symbols and the corresponding histograms indicate three types of galaxies based on their morphology: (i) early spirals, SO-Sa (red); (ii) intermediate spirals, Sab-Sb (green) and (iii) late spirals, Sc-Sm (blue). Bottom-left panel: similar distribution of slopes as a function of the presence or absence of bars. The colors of the symbols and the corresponding histograms indicate three types of galaxies: (i) clearly unbarred (red); (ii) not clear if there is a bar or not (green) and (iii) clearly barred galaxies (blue). Bottom-right panel: similar distribution of slopes as a function of the absolute magnitude of the galaxies. The colors of the symbols and the corresponding histograms indicate three types of galaxies based on the luminosity: (i) luminous galaxies, Mg−SDSS < −20.25 mag (red); (ii) intermediate galaxies −19.5 < Mg−SDSS < −20.25 mag (green) and (iii) faint galaxies Mg−SDSS > −19.5 mag (blue). The size of the symbols are inversely proportional to the derived error in the slope for all the panels.
Current usage metrics show cumulative count of Article Views (full-text article views including HTML views, PDF and ePub downloads, according to the available data) and Abstracts Views on Vision4Press platform.
Data correspond to usage on the plateform after 2015. The current usage metrics is available 48-96 hours after online publication and is updated daily on week days.
Initial download of the metrics may take a while.