Fig. A.1
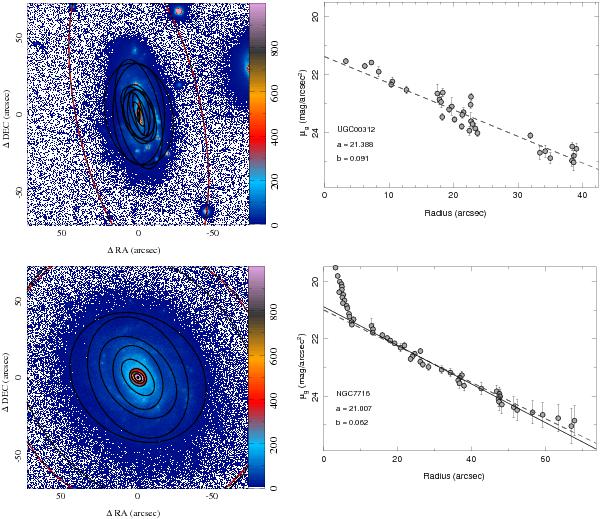
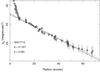
Left panels: color-scale representation of 1.5′× 1.5′ postage-stamp images extracted from the SDSS g-band data (in counts), centered on two CALIFA targets (UGC 00312 and NGC 7716), together with a set of ellipses (solid-black lines) representing the recovered shape at different isophotal intensity levels by the analysis described in the text. The last dashed red-black ellipse represents the 1σ isophotal intensity level over the background, adopting the median ellipticity and position angle to plot it. Right panels: surface brightness profiles derived for the considered galaxies on the basis of the corresponding isophotal analysis (gray solid circles), together with the best fit to an exponential profile for the portion of the surface brightness dominated by the disk (gray dashed line). For NGC 7716 a previous iteration of the fitting procedure is shown, before the rejection of those values dominated by the bulge (solid-line).
Current usage metrics show cumulative count of Article Views (full-text article views including HTML views, PDF and ePub downloads, according to the available data) and Abstracts Views on Vision4Press platform.
Data correspond to usage on the plateform after 2015. The current usage metrics is available 48-96 hours after online publication and is updated daily on week days.
Initial download of the metrics may take a while.