Fig. 12
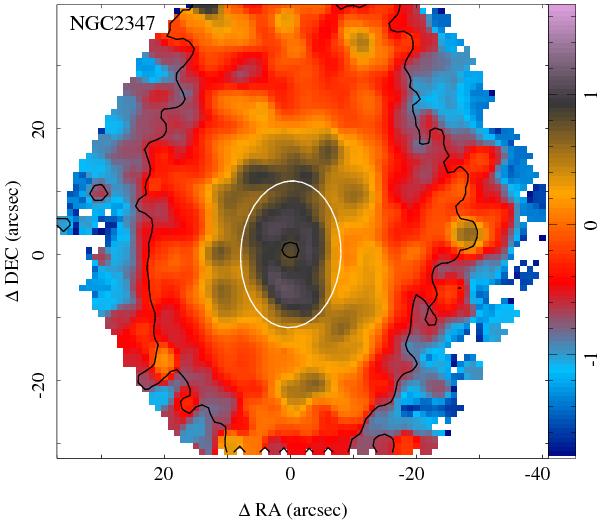
Color-coded image of the Hα intensity flux, on a logarithmic scale of 10-16 erg s-1 cm-2 arcsec-1units, corresponding to NGC 2347 (the galaxy shown in Fig. 11). The contours represent the flux intensity in the V-band, extracted from the datacube the datacube, at two intensity levels, 0.2 × 10⁻¹⁷ erg s-1 cm-2 arcsec-1 (corresponding to ~3σ detection limit in the continuum) and 15 × 10-17 erg s-1 cm-2 arcsec-1, included to illustrate the location of the center of the galaxy. The white ellipse indicates the location of the knee/peak in the radial abundance shown in Fig. 11.
Current usage metrics show cumulative count of Article Views (full-text article views including HTML views, PDF and ePub downloads, according to the available data) and Abstracts Views on Vision4Press platform.
Data correspond to usage on the plateform after 2015. The current usage metrics is available 48-96 hours after online publication and is updated daily on week days.
Initial download of the metrics may take a while.