Fig. 1
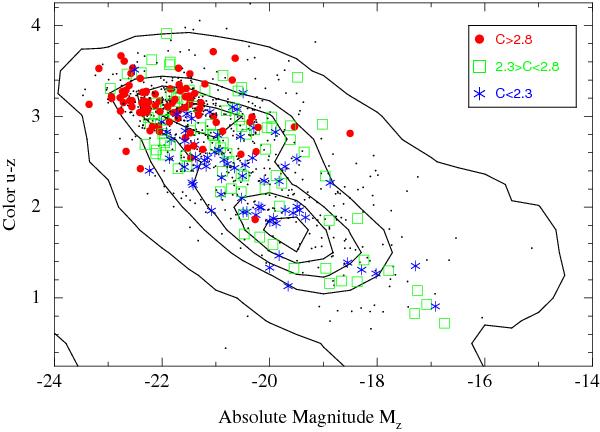
Distribution of the currently observed CALIFA galaxies in the u − z vs. Mz color–magnitude diagram. Different colors and symbols represent a classification into spheroid- and disk-dominated galaxies as well as intermediate cases, as suggested by the concentration index C (see Sect. 2 for definition). For comparison, the contours delineate the number density distribution of galaxies in the SDSS-NYU catalogue (e.g., Blanton et al. 2005). The small dots indicate the remaining objects in the CALIFA mother sample, not observed so far.
Current usage metrics show cumulative count of Article Views (full-text article views including HTML views, PDF and ePub downloads, according to the available data) and Abstracts Views on Vision4Press platform.
Data correspond to usage on the plateform after 2015. The current usage metrics is available 48-96 hours after online publication and is updated daily on week days.
Initial download of the metrics may take a while.