Fig. 1
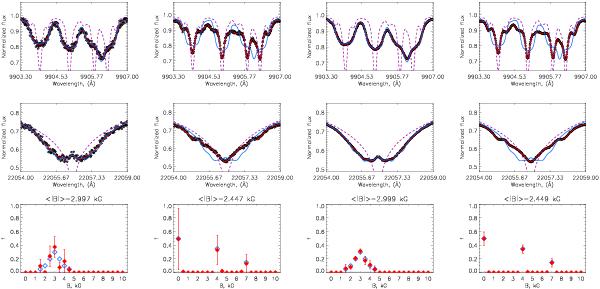
Forward simulation of FeH and Na i lines assuming two different distributions of surface magnetic fields. Thick black symbols: simulated observed spectrum; dashed violet line: computation with zero magnetic field; red line: computation with multi-component magnetic field shown on the bottom plots; blue line : computations with homogeneous magnetic field (i.e. f = 1) of the same average intensity as multi-component magnetic field. Columns 1–4 correspond to the assumed S/N of 100 and 500, respectively. Atmospheric parameters are the same for all simulations. Open blue diamonds in the bottom plots show the true distribution of filling factors used to simulate observations.
Current usage metrics show cumulative count of Article Views (full-text article views including HTML views, PDF and ePub downloads, according to the available data) and Abstracts Views on Vision4Press platform.
Data correspond to usage on the plateform after 2015. The current usage metrics is available 48-96 hours after online publication and is updated daily on week days.
Initial download of the metrics may take a while.