Fig. 10
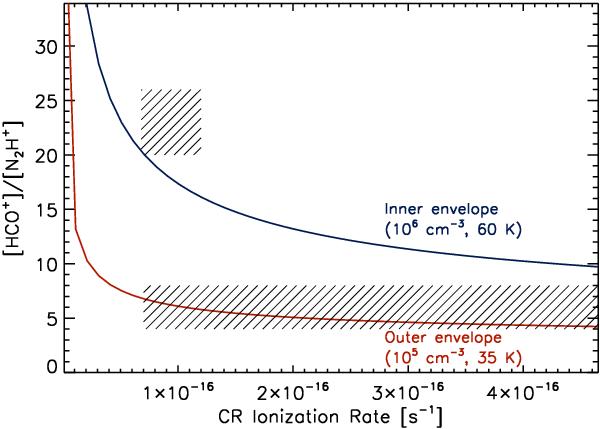
[HCO+]/[N2H+] abundance ratio as a function of the CR ionization rate computed for the inner (blue line) and outer (red line) envelope components using the Nahoon code. The shaded areas represent the results obtained within the uncertainties listed in Table 3. The ζH2 values in the upper-left and lower-right corners of the shaded areas correspond to the maximum and minimum values of the [HCO+]/[N2H+] ratio, respectively (see text for discussion).
Current usage metrics show cumulative count of Article Views (full-text article views including HTML views, PDF and ePub downloads, according to the available data) and Abstracts Views on Vision4Press platform.
Data correspond to usage on the plateform after 2015. The current usage metrics is available 48-96 hours after online publication and is updated daily on week days.
Initial download of the metrics may take a while.