Fig. 8
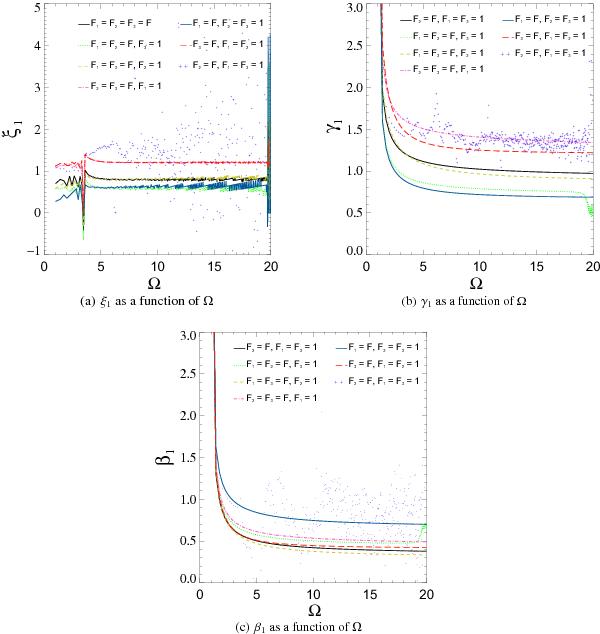
Local scalings ξ1 for p, γ1 for |A|, and β1 for |B| are plotted as functions of rotation rate for different combinations of F1, F2, and F3, where for different combinations, different colours/linestyles are assigned as: for F1 = F2 = F3 = F black/solid line, F1 = F2 = F,F3 = 1 green/dot, F1 = F3 = F,F2 = 1 gold/dash, F1 = 1, F2 = F,F3 = F pink/dash dot, F1 = F,F2 = F3 = 1 turquoise/dash dot dot, F1 = F2 = 1, F3 = F red/long dash, F1 = F3 = 1, F2 = F turquoise/“+”.
Current usage metrics show cumulative count of Article Views (full-text article views including HTML views, PDF and ePub downloads, according to the available data) and Abstracts Views on Vision4Press platform.
Data correspond to usage on the plateform after 2015. The current usage metrics is available 48-96 hours after online publication and is updated daily on week days.
Initial download of the metrics may take a while.