Fig. 7
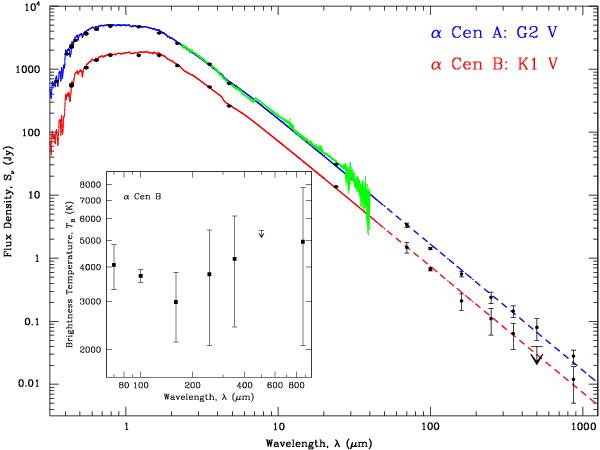
SEDs of the binary α Cen AB. The model photospheres for the individual stars are shown by the blue and red lines. The PHOENIX model computations extend to about 45 μm (solid lines). At longer wavelengths, these correspond to extrapolations using the proper Bν(Teff) (dashes). Photometric data points are shown for comparison, with the upper limit being 3σ (Table 2). The green curve shows an ISO-SWS low-resolution observation, viz. TDT 60702006 (PI Waelkens; see also Decin et al. 2003). The inset displays the SED of the secondary α Cen B in the FIR/submm spectral region.
Current usage metrics show cumulative count of Article Views (full-text article views including HTML views, PDF and ePub downloads, according to the available data) and Abstracts Views on Vision4Press platform.
Data correspond to usage on the plateform after 2015. The current usage metrics is available 48-96 hours after online publication and is updated daily on week days.
Initial download of the metrics may take a while.