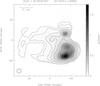
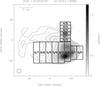
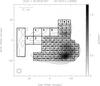
Fig. 1

a): 22 GHz continuum image of the two cometary H ii regions in DR 21. The contour levels are 0.01, 0.02, 0.05, 0.1, 0.2, 0.5, and 1 Jy beam-1, chosen to match the contour levels of Fig. 2 in Paper I as closely as possible. (The lowest contour level in Fig. 2 of Paper I is 0.02 Jy beam-1.) b) and c): same as a). The boxes show the areas over which the emission was summed to generate the “long slit” b) and the “box” c) spectra in Figs. 3 and 4. The numbers in the boxes correspond to the position numbers in Tables 1 and 2, respectively. In each panel, the 3.4″ (FWHM) synthesized beam is shown in the lower left corner and a scale bar of 0.1 pc is shown in the upper left corner.
Current usage metrics show cumulative count of Article Views (full-text article views including HTML views, PDF and ePub downloads, according to the available data) and Abstracts Views on Vision4Press platform.
Data correspond to usage on the plateform after 2015. The current usage metrics is available 48-96 hours after online publication and is updated daily on week days.
Initial download of the metrics may take a while.