| Issue |
A&A
Volume 563, March 2014
|
|
|---|---|---|
| Article Number | A90 | |
| Number of page(s) | 6 | |
| Section | Extragalactic astronomy | |
| DOI | https://doi.org/10.1051/0004-6361/201321360 | |
| Published online | 14 March 2014 | |
Research Note
Discovery of very high energy gamma-ray emission from the blazar 1ES 1727+502 with the MAGIC Telescopes
1
IFAE, Edifici Cn., Campus UAB,
08193
Bellaterra,
Spain
2
INAF, National Institute for Astrophysics,
00136
Rome,
Italy
3
Università di Siena, and INFN Pisa, 53100
Siena,
Italy
4
Universidad Complutense, 28040
Madrid,
Spain
5
Technische Universität Dortmund, 44221
Dortmund,
Germany
6
Max-Planck-Institut für Physik, 80805
München,
Germany
7
Inst. de Astrofísica de Canarias, 38200
La Laguna, Tenerife,
Spain
e-mail:
berger.karsten@gmail.com
8
University of Łódź, 90236
Lodz,
Poland
9
Depto. de Astrofísica, Universidad de La Laguna,
38206
La Laguna,
Spain
10
Deutsches Elektronen-Synchrotron (DESY),
15738
Zeuthen,
Germany
e-mail:
gessica.de.caneva@desy.de
11
ETH Zurich, CH-8093
Zurich,
Switzerland
12
Universität Würzburg, 97074
Würzburg,
Germany
13
Centro de Investigaciones Energéticas, Medioambientales y
Tecnológicas, 28040
Madrid,
Spain
14
Università di Udine, and INFN Trieste, 33100
Udine,
Italy
15
Inst. de Astrofísica de Andalucía (CSIC),
18080
Granada,
Spain
16
Croatian MAGIC Consortium, Rudjer Boskovic Institute, University
of Rijeka and University of Split, 10000
Zagreb,
Croatia
17
Unitat de Física de les Radiacions, Departament de Física, and
CERES-IEEC, Universitat Autònoma de Barcelona, 08193
Bellaterra,
Spain
18
Università dell’Insubria, Como, 22100
Como,
Italy
19
Institut de Ciències de l’Espai (IEEC-CSIC),
08193
Bellaterra,
Spain
20
Tuorla Observatory, University of Turku,
21500
Piikkiö,
Finland
21
Japanese MAGIC Consortium, Division of Physics and Astronomy,
Kyoto University, 277-8582, Chiba,
Kashiwa, Japan
22
Inst. for Nucl. Research and Nucl. Energy,
1784
Sofia,
Bulgaria
23
Universitat de Barcelona (ICC/IEEC), 08028
Barcelona,
Spain
24
Università di Padova and INFN, 35131
Padova,
Italy
25
INAF/Osservatorio Astronomico and INFN,
34143
Trieste,
Italy
26
Università di Pisa, and INFN Pisa, 56126
Pisa,
Italy
27
ICREA, 08010
Barcelona,
Spain
28
Now at École polytechnique fédérale de Lausanne
(EPFL), 1015
Lausanne,
Switzerland
29 Supported by INFN Padova
30
Now at: Department of Physics & Astronomy,
UC Riverside, CA
92521,
USA
31
Now at: DESY, 15738
Zeuthen,
Germany
32
Now at: Finnish Centre for Astronomy with ESO (FINCA), University
of Turku, 21500
Piikkiö,
Finland
33
Also at Instituto de Fisica Teorica, UAM/CSIC, 28049
Madrid,
Spain
Received: 25 February 2013
Accepted: 4 October 2013
Motivated by the prediction of a high TeV luminosity we investigated whether the blazar 1ES 1727+502 (z = 0.055) is emitting very high energy (VHE, E > 100 GeV) γ rays. We observed the BL Lac object 1ES 1727+502 in stereoscopic mode with the two MAGIC telescopes for 14 nights between May 6th and June 10th 2011, for a total effective observing time of 12.6 h. To study the multiwavelength spectral energy distribution (SED), we used simultaneous optical R-band data from the KVA telescope, archival UV/optical and X-ray observations from instruments UVOT and XRT on board of the Swift satellite, and high energy (HE, 0.1 GeV–100 GeV) γ-ray data from the Fermi-LAT instrument. We detected, for the first time, VHE γ-ray emission from 1ES 1727+502 at a statistical significance of 5.5σ. The integral flux above 150 GeV is estimated to be (2.1 ± 0.4)% of the Crab nebula flux and the de-absorbed VHE spectrum has a photon index of (2.7 ± 0.5). No significant short-term variability was found in any of the wavebands presented here. We model the SED using a one-zone synchrotron self-Compton model obtaining parameters typical for this class of sources.
Key words: galaxies: active / BL Lacertae objects: individual: 1ES 1727+502
© ESO, 2014
1. Introduction
Since the detection of the first extragalactic VHE γ-ray source, Mrk 421 in 1992 by the Whipple Observatory (Punch et al. 1992), the extragalactic VHE sky turned out to be densely populated. Currently, around 50 extragalactic sources1 are known, most of them blazars, i.e., active galactic nuclei (AGN) with a relativistic jet pointed towards the Earth. Blazars can be further divided into BL Lacertae objects (BL Lacs) and flat spectrum radio quasars (FSRQs). The former class constitutes the vast majority of blazars detected so far in the VHE γ-ray regime. Their spectral energy distributions (SEDs) are characterized by two broad peaks, located in the radio – IR – optical – UV – X-ray regime and the HE – VHE γ-ray bands, respectively. BL Lacs are further divided into high frequency peaked BL Lacs (HBL) and low frequency peaked BL Lacs (LBL, Padovani & Giommi 1995). Their emission is generally believed to be caused by a population of relativistic electrons, trapped in a region with magnetic field, that emit synchrotron photons, forming the low-energy peak. Those photons are then up-scattered to higher energies by the same population of electrons, through the inverse Compton process, to form the second bump (SSC, synchrotron self Compton scenario).
Imaging atmospheric Cherenkov telescopes carry on pointed observations in search for extragalactic sources and do not perform scans of the entire sky due to their limited field of view (~3.5°). The selection of promising candidates for VHE emission is thus of fundamental importance. The BL Lac object 1ES 1727+502, which we discuss in this paper, is the latest in a long list of MAGIC discoveries of objects selected from X-ray catalogues (e.g.), for 1ES 1727+502 Costamante & Ghisellini 2002, and for other sources, Donato et al. 2001). Among those are 1ES 1218+30.4 (Albert et al. 2006a), PG 1553+113 (Albert et al. 2007a), 1ES 1741+196 (Berger et al. 2011) and 1ES 0033+595 (Mariotti et al. 2011). Also many of the sources, whose discoveries have been triggered by an optical high state (Mrk180, Albert et al. 2006a; 1ES 1011+496, Albert et al. 2007b; B3 2247+381, Aleksić et al. 2012a; 1ES 1215+303, Aleksić et al. 2012b) are listed in the above mentioned catalogues.
The BL Lac 1ES 1727+502 (z = 0.055, de Vaucouleurs et al. 1991) was observed with the Whipple 10 m γ-ray telescope, in March–April 1995 and April–May 1996 for a total of 4.6 h but no signal from this source was detected. Upper limits above 300 GeV were reported for both data sets at the levels of 1.08 × 10⁻¹¹ erg cm-2 s-1 (8.6% Crab), and 1.58 × 10⁻¹¹ erg cm-2 s-1 (15% Crab), respectively (Horan et al. 2004). It was also a target of the single telescope MAGIC-I (Albert et al. 2008a), before starting stereoscopic observations with two MAGIC telescopes (Aleksić et al. 2012c). It was observed between May 2006 and May 2007 for ~6.1 h, with zenith angles from 21° to 36°. An upper limit on the integral flux of 3.6 × 10⁻¹¹ cm-2 s-1 above 140 GeV (11.8% of the Crab nebula flux above 140 GeV) was calculated. These observations were merged with those from 20 other pre-selected blazars observed between 2004 and 2009, and analysed with a stacking method (Aleksić et al. 2011). The combined dataset of 394.1 h of exposure time resulted in a detection of VHE γ rays with a statistical significance of 4.9σ, thus indicating that at least some of those blazars are VHE γ-ray emitters. In June 2010, a high optical flux of 1ES 1727+502 triggered target of opportunity observations with the MAGIC telescopes. Unfortunately, the data were unusable due to adverse atmospheric conditions.
The hard spectrum in the HE band (spectral index 2.0 in the Fermi-LAT first source catalogue, Abdo et al. 2010), combined with the better sensitivity achieved by the MAGIC telescopes with respect to the one of 2006 and 2007 observations, motivated renewed MAGIC observations in 2011. These are described in the following sections. In the second Fermi-LAT catalogue (Nolan et al. 2012), the object 1ES 1727+502 (2FGL J1728.2+5015) confirmed a hard spectrum with spectral index of 1.8.
2. MAGIC observations and results
2.1. Observations and data analysis
The VHE γ-ray observations were performed with the MAGIC telescopes located on the Canary Island of La Palma (28.8° N, 17.8° W at 2200 m.a.s.l). The two 17 m telescopes use the imaging atmospheric Cherenkov technique, with a sensitivity of (0.76 ± 0.03)% of the Crab nebula flux2. The energy threshold can be as low as 50 GeV, a characteristic that makes the MAGIC telescopes well suited for discovering and studying extragalactic VHE γ-ray sources.
The BL Lac object 1ES 1727+502 was observed with the two MAGIC telescopes, using a hardware stereo trigger, between May 6th and June 10th 2011. For 14 nights, 20.2 h of data were collected. After a quality selection based on the event rate, excluding runs taken during adverse atmospheric conditions or those with technical problems, the final data sample amounts to 14.0 h. The effective time of this observation, corrected for the dead time of the trigger and readout systems, is 12.6 h. Parts of the data were taken under moderate moonlight and twilight conditions and were analysed with the dark data (Britzger et al. 2009). The source was observed at zenith angles between 22° and 50°.
All the data were taken in the false-source tracking mode (wobble, Fomin et al. 1994), in which the telescopes alternate between two sky positions every 20 min at 0.4° offset from the source.
The data were analysed using the standard MAGIC analysis framework MARS as described in Moralejo et al. (2009) with additional adaptations incorporating the stereoscopic observations (Lombardi et al. 2011). The images were cleaned using timing information as described in Aliu et al. (2009) with absolute cleaning levels of six photoelectrons (so-called “core pixels”) and three photoelectrons (“boundary pixels”) for the first telescope and nine photoelectrons and 4.5 photoelectrons for the second telescope. The images were parameterized in each telescope separately following the prescription of Hillas (1985).
We reconstructed the shower arrival direction with the random forest regression method (RF DISP method, Aleksić et al. 2010), which was extended using stereoscopic information such as the height of the shower maximum and the impact distance of the shower on the ground (Lombardi et al. 2011).
For the gamma-hadron separation, the random forest method was used (Albert et al. 2008b). In the stereoscopic analysis, image parameters of both telescopes were used as well as the shower impact point and the shower height maximum. We additionally rejected events whose reconstructed source position in each telescope differs by more than 0.05 degree2. A detailed description of the stereoscopic MAGIC analysis can be found in Aleksić et al. (2012c).
2.2. Results
In the distribution of the squared angular distance between the catalogue position of 1ES 1727+502 and the reconstructed source position in the MAGIC data, the so-called θ2 plot shown in Fig. 1, we find an excess (Nex) of (73.8 ± 15.0) events above the normalized background (Noff) of (125.2 ± 5.0) events in the energy range above 150 GeV. This corresponds to a significance of 5.5σ calculated with formula 17 of Li & Ma (1983), marking this observation as the first detection of 1ES 1727+502 in the VHE γ-ray regime. The integral flux above 150 GeV is (2.1 ± 0.4)% of the Crab nebula flux. The fitted position of the excess is consistent with the catalogue coordinates (RA: 17.47184°, Dec: 50.21956° as in Ma et al. 1998) within (0.032 ± 0.015stat ± 0.025sys)°, and thus compatible within the expected statistical and systematic errors (Aleksić et al. 2012c). Comparing the extension of the excess to the point spread function of MAGIC (~0.1°, Aleksić et al. 2012b), the source appears to be point-like.
To take the effects of the finite energy resolution of the instrument into account, we unfolded the spectrum using the forward unfolding algorithm (described in Albert et al. 2007c). In the same procedure, the flux was corrected for the absorption due to the extragalactic background light pair-production using the model developed by Domínguez et al. (2011). The obtained differential flux can be described by a power law function dF/dE = f0(E/300 GeV)−Γ with the following values of the parameters: flux normalisation f0 = (9.6 ± 2.5) × 10-12 cm-2 s-1 TeV-1 and spectral index Γ = (2.7 ± 0.5). We estimate a 10% additional systematic uncertainty in the measured flux compared to Aleksić et al. (2012c) due to the inclusion of moonlight and large zenith angle conditions in our data.
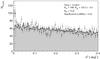 |
Fig. 1 Distribution of the squared angular distance (θ2) between the source position and the reconstructed γ-ray direction for ON-source events (black points) and normalized OFF-source events (grey shaded area). The dashed line corresponds to the predefined region selected for the calculation of the significance of the detection. The respective statistics for ON and normalized OFF events are given in the figure. |
In Fig. 2 we present the VHE γ-ray light curve between 200 GeV and 2 TeV. To have a uniform distribution of days with observations in the bins and due to the weakness of the signal, a 14 day binning is applied starting from 2011 May 4. The resulting light curve has five observation nights in the first and last bin and four in the second bin. The emission is compatible with a constant flux of (2.6 ± 0.8) × 10-12 cm-2 s-1. The relatively low probability of a constant flux (0.6%, corresponding to a 2.5σ rejection) might indicate variability below our detection threshold. The sparse binning and additional systematic errors due to moonlight and larger zenith angles can fully explain this effect.
3. Multiwavelength properties
3.1. Optical observations and results
We observed 1ES 1727+502 continually in the optical R-band as part of the Tuorla blazar monitoring program3 for almost ten years, starting in 2002. The observations were carried out with the 1 m Tuorla telescope and 35 cm KVA telescope in La Palma. The brightness of the object was inferred from calibration stars in the same CCD-frames as 1ES 1727+502 using differential photometry and comparison star magnitudes from Fiorucci & Tosti (1996). We converted the magnitudes to fluxes using the standard formula and values from Bessell (1979).
1ES 1727+502 has a bright host galaxy, contributing >50% to the flux in the optical R-band (Nilsson et al. 2007). To derive the νFν in the optical band, this contribution is subtracted from the measured flux and, in addition, the brightness is corrected for galactic absorption by R = 0.079 mag (Schlegel et al. 1998). The average νFν during the MAGIC observations corresponds to (4.93 ± 0.2) × 10-12 erg cm-2 s-1.
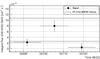 |
Fig. 2 MAGIC light curve in the energy range from 200 GeV to 2 TeV. The Crab nebula flux (Aleksić et al. 2012c) scaled to 5% is shown for comparison (dashed line). The points correspond to the 14 days binned flux of 1ES 1727+502, and the error bars represent the statistical error only. The line represents the average flux during the entire observing period. The probability of a constant flux is 0.6% and the reduced χ2 with the number of degrees of freedom nd.o.f. of the fit assuming a constant flux is 10.12/2. |
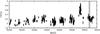 |
Fig. 3 Ten years light curve in the optical R-band from the Tuorla blazar monitoring program. The contribution of the host galaxy (1.25 ± 0.06 mJy) has not been subtracted. Vertical lines indicate beginning and end of the MAGIC observing window in 2011. See text for details. |
Results of Swift/XRT observations: observation date in MJD, exposure time, integral flux in the energy range 2–10 keV, photon index of a simple power law fit function, reduced χ2 with the number of degrees of freedom nd.o.f..
Overall, the source showed mainly quiescent behaviour (as shown in Fig. 3) with the exception of an increased R-band flux starting in March-April 2010 with a peak value of 2.85 ± 0.05 mJy on 2010 May 31, which exceeded the trigger criteria (>50% above the long-term average) for MAGIC observations. However, as discussed in the introduction, the adverse atmospheric conditions forced us to discard the MAGIC data. The source had almost returned to its quiescent flux, 2.0–2.2 mJy, in September 2010 and also remained in this state during the MAGIC observations performed in 2011.
3.2. Analysis and results of the Swift archival data
The Swift Gamma-Ray Burst observatory, launched in November 2004 (Gehrels et al. 2004), is equipped with three telescopes: the Burst Alert Telescope (BAT; Barthelmy et al. 2005), which covers the 15−150 keV range; the X-ray telescope (XRT; Burrows et al. 2005), covering the 0.3−10 keV energy band; and the UV/Optical Telescope (UVOT; Roming et al. 2005), covering the 1800−6000 Å wavelength range. Unfortunately, there are no simultaneous Swift observations during the MAGIC observing window. We used archival data from April 5th and May 1st 2010. We processed the data with standard procedures using the publicly available tools of the HEASoft package distributed by HEASARC.
The results from Swift/XRT are summarized in Table 1. We fit the data with a simple power law in the range between 0.5−10 keV. The flux is stable to within ~30% for this period. Swift/UVOT observations were performed on the same dates, but only one of the observations, on April 5th, 2010 (MJD 55 291.96182) contains all filters (V, B, U, W1, M2, W2). Therefore we only used this dataset for the compilation of the SED. The host galaxy contribution in the V and B bands was extrapolated from the R-band values from Nilsson et al. (2007) using the galaxy colours at z = 0 from Fukugita et al. (1995). The host galaxy contribution in the U and ultraviolet bands is negligible. All the observed magnitudes were corrected for Galactic extinction E(B − V) = 0.029 mag (Schlegel et al. 1998), R = 0.079, V = 0.098, B = 0.127, U = 0.160 (taken from NED4), and for the UV data W1 = 0.185, M2 = 0.272 and W2 = 0.243 using the curve from Fitzpatrick & Massa (1999) and the central wavelengths from Poole et al. (2008). Final magnitudes have been converted into νFν and are summarized in Table 2.
Results of Swift/UVOT observations from 2010 April 5.
These archival Swift/UVOT data were taken on 2010 April 5 when the optical flux was already increasing, but before it reached the highest value on 2010 May 31. Unfortunately, there were no simultaneous observations together with the KVA telescope, but the R-band SED point has a flux value of 4.93 ± 0.2 × 10⁻¹² erg cm-2 s-1, which is comparable to spectral points obtained from Swift/UVOT data (see Table 2). Consequently, the archival Swift/UVOT can be regarded as representative of the baseline optical-UV flux and can be included in the compilation of the multiwavelength SED.
3.3. Fermi-LAT data analysis and results
1ES 1727+502 has been observed with the pair conversion Large Area Telescope (LAT) aboard Fermi, operating in the energy range from 20 MeV up to energies beyond 300 GeV (Atwood et al. 2009). In survey mode, the Fermi-LAT scans the entire sky every three hours. The data sample used for this analysis covers observations from August 5th, 2008 to August 5th, 2011 and was analysed with the standard analysis tool gtlike, part of the Fermi ScienceTools software package (version 09-27-01) available from the Fermi Science Support Center (FSSC). Only events belonging to the Pass7-V6 Source class and located within 10° of 1ES 1727+502 were selected. Moreover, to reduce contamination from the Earth-limb γ rays produced by cosmic rays interacting with the upper atmosphere, the data were restricted to a maximal zenith angle of 100° and time periods when the spacecraft rocking angle exceeded 52° were excluded. To extract the source spectral information we used standard background models publicly available at the FSSC website5. The background template separately models the Galactic diffuse emission and an isotropic diffuse emission, resulting from extragalactic isotropic emission and residual instrumental background. The normalization of these two templates were left free in the subsequent spectral fitting. Sources from the 2FGL catalogue (Nolan et al. 2012) located within 15° of 1ES 1727+502 were incorporated in the model of the region by setting their spectral models and initial parameters for modelling to those reported in the 2FGL catalogue. In the fitting procedure, the parameters of sources located within 10° radius centred on the source of interest were allowed to vary freely while parameters of sources located within the 10°–15° annulus were fixed. The model of the region around the source was forward folded with the post-launch instrument response functions P7SOURCE V6 and an unbinned maximum likelihood analysis was performed against the flight dataset between 300 MeV–300 GeV to derive the sources flux. The uncertainties here reported in the LAT flux measurements are statistical only; systematic uncertainty in the LAT flux can be derived from the systematic uncertainty on the effective area, which is estimated to be 10% at 100 MeV, 5% at 560 MeV ,and 10% at 10 GeV and above (Abdo et al. 2009).
Since the source is not always significantly detected, flux upper limits at 95% confidence level were calculated for each time bin where the test statistic (TS, two times the difference of the log (likelihood) with and without the source, see Mattox et al. 1996) value for the source was TS < 4 or the number of predicted photons Npred < 3. The light curve, from August 5th, 2008 to July 20th 2011, is presented in Fig. 4. Possible variations in the source emission have been tested following the same likelihood method described in the second Fermi catalogue (Nolan et al. 2012). The result obtained here are consistent with a constant flux (TSvar = 6 for 11 degrees of freedom), albeit a trend towards a higher flux in the last bin, partially coincident with the MAGIC observations, is possible. We also present in Fig. 5 the spectrum obtained from three months of observations centred around the MAGIC observing period. Compared to the average flux, in the energy range from 300 MeV to 300 GeV, measured in three years of observations (3.5 ± 0.5 × 10⁻⁹ph cm-2 s-1), the flux measured in the three months around the MAGIC observations is higher (7.2 ± 1.9 × 10⁻⁹ph cm-2 s-1), while the spectral indices are similar (1.90 ± 0.08 and 2.0 ± 0.2, respectively). When performing the fit for the light curve and SED bins, the spectral indices of the sources were frozen to the best-fit values obtained from the time-independent analysis.
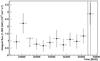 |
Fig. 4 Light curve with a binning of three months of the Fermi-LAT data between 1 GeV and 300 GeV. The downward pointing arrows correspond to a 95% upper limit. The vertical lines indicate beginning and end of the MAGIC observing window in 2011. The emission is consistent with a constant flux, although a trend towards a higher flux in the last bin, partially coincident with the MAGIC observations, is evident. |
3.4. Multiwavelength spectral energy distribution
We use the quasi-simultaneous multiwavelength data described in the previous section for the compilation of the SED, which is modelled with a one-zone SSC model (Maraschi & Tavecchio 2003). In this scenario, a blob of radius R populated by relativistic electrons and filled with a tangled magnetic field of intensity B, is moving down the jet with a Doppler factor δ. The electrons emit synchrotron radiation, producing the low-energy peak in the SED. The γ rays are produced by the same electron population up-scattering the synchrotron photons, resulting in the second peak in the SED.
The electron spectrum is assumed to be described by N(γ) = Kγ−n1(1 + γ/γb)n1−n2. Though a power law with exponential cut-off would be more naturally motivated by particle acceleration theory, we find that only a broken power law spectrum can reproduce the measured spectral energy distribution beyond the synchrotron peak. Specifically, the relatively flat power law spectrum measured by XRT is inconsistent with a rapidly (exponentially) decreasing spectrum that an exponential cut-off would predict. Indeed, this is the typical situation encountered in the modelling of these sources, motivating the use of phenomenological electron spectra as applied here (see, e.g., Tavecchio et al. 1998; Zhang et al. 2012) or similar (e.g., the log-parabola distribution discussed in Tramacere et al. 2011), which provide more symmetric peaks in the SED.
The parameter values that provide a good match between the SSC model and SED data are: Lorentz factors γmin = 100,γb = 3 × 10⁴,γmax = 6 × 10⁵; slopes n1 = 2,n2 = 3.5; and electron density K = 8 × 103 cm-3. The parameters that describe the astrophysical environment are a magnetic field of B = 0.1 G, a radius of R = 7 × 1015 cm; and a Doppler factor of δ = 15 of the emitting region. These values are compatible with the values obtained with the sample analyzed in Tavecchio et al. (2010).
With the derived parameters, the emission region is far (by two orders of magnitude) from equipartition between magnetic (UB = 4 × 10⁻⁴ erg cm-3) and electron (Ue = 4 × 10⁻² erg cm-3) energy density. This is a situation frequently encountered in the models of TeV BL Lac objects (e.g., Tavecchio et al. 2010; Aleksić et al. 2011; Mankuzhiyil et al. 2012; Zhang et al. 2012).
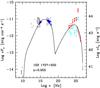 |
Fig. 5 Multiwavelength spectral energy distribution fitted with a one zone synchrotron self Compton model (Maraschi & Tavecchio 2003). MAGIC observations (red butterfly), have been corrected for the extragalactic background light absorption using the model of Domínguez et al. (2011). The data used for the fit are: optical from KVA (red square), archival UV and optical from Swift/UVOT and archival X-ray from Swift/XRT (blue triangles), HE γ rays from Fermi-LAT (red triangles, three months centred around the MAGIC observing period) and VHE γ rays from MAGIC. We also show the three year LAT data (light blue triangles) and archival data (grey) from the ASI/ASDC archive (http://tools.asdc.asi.it/). |
4. Discussion
The HBL 1ES 1727+502 shows little variability in the optical R-band, is bright in the X-ray band, has a hard spectrum in the HE γ-ray band and, as shown in this paper, is visible in the VHE γ-ray range. The discovery of this source as VHE γ-ray emitter demonstrates the importance of combining data at different wavelengths, namely radio, optical, X-ray, and the recently opened Fermi-LAT energy range, to help identify potential VHE γ-ray emitters. The MAGIC detection confirms the prediction made by Costamante & Ghisellini (2002) and Donato et al. (2001) more than ten years ago, using X-ray, optical, and radio data. Of the 33 sources in the list they compiled, 21 have been already detected. They predicted a flux of 0.7 × 10⁻¹² cm-2 s-1 above 300 GeV and we observed a flux of a factor of two higher (1.6 × 10⁻¹² cm-2 s-1).
Furthermore, it is also interesting to compare this result with the excess seen in the stacked AGN sample observed by MAGIC in mono mode (Aleksić et al. 2011). The spectral index measured for 1ES 1727+502 in the MAGIC energy range is compatible with the average spectral index of the stacked AGN sample: (2.7 ± 0.5) compared to (3.2 ± 0.5). Finally, when compared to the sample of all blazars detected in VHE γ-rays, its spectral index has the value of a typical BL Lac, while the flux is one of the lower fluxes detected so far (Becerra et al. 2012; Becerra et al., in prep.).
We modelled the emission with a single-zone SSC model and found that the model parameters are similar to those obtained for other HBL sources. Regarding the multiwavelength variability of the source, during MAGIC observations the source was in a quiescent state in the optical band and the Fermi-LAT energy range. There is a possibility that the LAT γ-ray flux was higher during our observing window compared to the three year averaged value. A study of the multiwavelength variability of this source is strongly recommended.
In 50 h of effective time in the medium energy range >290 GeV, see Aleksić et al. (2012c) for details.
Acknowledgments
We would like to thank the Instituto de Astrofísica de Canarias for the excellent working conditions at the Observatorio del Roque de los Muchachos in La Palma. The support of the German BMBF and MPG, the Italian INFN, the Swiss National Fund SNF, and the Spanish MICINN is gratefully acknowledged. This work was also supported by the CPAN CSD2007-00042 and MultiDark CSD2009-00064 projects of the Spanish Consolider-Ingenio 2010 programme, by grant DO02-353 of the Bulgarian NSF, by grant 127740 of the Academy of Finland, by the DFG Cluster of Excellence “Origin and Structure of the Universe”, by the DFG Collaborative Research Centers SFB823/C4 and SFB876/C3, and by the Polish MNiSzW grant 745/N-HESS-MAGIC/2010/0. The Fermi-LAT Collaboration acknowledges support from a number of agencies and institutes for both development and the operation of the LAT as well as scientific data analysis. These include NASA and DOE in the United States, CEA/Irfu and IN2P3/CNRS in France, ASI and INFN in Italy, MEXT, KEK, and JAXA in Japan, and the K. A. Wallenberg Foundation, the Swedish Research Council and the National Space Board in Sweden. Additional support from INAF in Italy and CNES in France for science analysis during the operations phase is also gratefully acknowledged.
References
- Abdo, A. A., Ackermann, M., Ajello, M., et al. 2009, Astropart. Phys., 32, 193 [NASA ADS] [CrossRef] [Google Scholar]
- Abdo, A. A., Ackermann, M., Ajello, M., et al. 2010, ApJS, 188, 405 [NASA ADS] [CrossRef] [Google Scholar]
- Ackermann, M., Ajello, M., Albert, A., et al. 2012, ApJS, 203, 4 [NASA ADS] [CrossRef] [Google Scholar]
- Albert, J., Aliu, E., Anderhub, H., et al. 2006a, ApJ, 642, L119 [NASA ADS] [CrossRef] [Google Scholar]
- Albert, J., Aliu, E., Anderhub, H., et al. 2006b, ApJ, 648, L105 [NASA ADS] [CrossRef] [Google Scholar]
- Albert, J., Aliu, E., Anderhub, H., et al. 2007a, ApJ, 654, L119 [NASA ADS] [CrossRef] [Google Scholar]
- Albert, J., Aliu, E., Anderhub, H., et al. 2007b, ApJ, 667, L21 [NASA ADS] [CrossRef] [Google Scholar]
- Albert, J., Aliu, E., Anderhub, H., et al. 2007c, Nucl. Instr. Meth. A, 583, 494 [Google Scholar]
- Albert, J., Aliu, E., Anderhub, H., et al. 2008a, ApJ, 674, 1037 [NASA ADS] [CrossRef] [Google Scholar]
- Albert, J., Aliu, E., Anderhub, H., et al. 2008b, Nucl. Instr. Meth. A, 588, 424 [Google Scholar]
- Aleksić, J., Antonelli, L. A., Antoranz, P., et al. 2010, A&A, 524, A77 [NASA ADS] [CrossRef] [EDP Sciences] [Google Scholar]
- Aleksić, J., Antonelli, L. A., Antoranz, P., et al. 2011, ApJ, 729, 115 [NASA ADS] [CrossRef] [Google Scholar]
- Aleksić, J., Alvarez, E. A., Antonelli, L. A., et al. 2012a, A&A, 539, A118 [NASA ADS] [CrossRef] [EDP Sciences] [Google Scholar]
- Aleksić, J., Alvarez, E. A., Antonelli, L. A., et al. 2012b, A&A, 544, A142 [NASA ADS] [CrossRef] [EDP Sciences] [Google Scholar]
- Aleksić, J., Alvarez, E. A., Antonelli, L. A., et al. 2012c, Astropart. Phys., 35, 435 [NASA ADS] [CrossRef] [Google Scholar]
- Aliu, E., Anderhub, H., Antonelli, L. A., et al. 2009, ApJ, 692, L29 [NASA ADS] [CrossRef] [Google Scholar]
- Atwood, W. B., Abdo, A. A., Ackermann, A., et al. 2009, ApJ, 697, 1071 [NASA ADS] [CrossRef] [Google Scholar]
- Barthelmy, S. D., Barbier, L. M., Cummings, J. R., et al. 2005, Space Sci. Rev., 120, 143 [NASA ADS] [CrossRef] [Google Scholar]
- Becerra, J., Raue, M., & Wagner, R. M. 2012, AIP Conf. Proc. 1505, 550 [Google Scholar]
- Berger, K. 2011, in Proc. 32nd ICRC (Beijing) [arXiv:1109.5860] [Google Scholar]
- Bessell, M. S. 1979, PASP, 91, 589 [NASA ADS] [CrossRef] [Google Scholar]
- Britzger, D., Carmona, E., Majumdar, P., et al. 2009, in Proc. 31st ICRC (Łódź) [arXiv:0907.0973v1] [Google Scholar]
- Burrows, D. N., Hill, J. E., Nousek, J. A., et al. 2005, Space Sci. Rev., 120, 165 [NASA ADS] [CrossRef] [Google Scholar]
- Costamante, L., & Ghisellini, G. 2002, A&A, 384, 56 [NASA ADS] [CrossRef] [EDP Sciences] [Google Scholar]
- de Vaucouleurs, G., de Vaucouleurs, A., Corwin, Jr., H. G., et al. 1991, Third Reference Catalogue of Bright Galaxies (New York: Springer) [Google Scholar]
- Domínguez, A., Primack, J. R., Rosario, D. J., et al. 2011, MNRAS, 410, 2556 [NASA ADS] [CrossRef] [Google Scholar]
- Donato, D., Ghisellini, G., Tagliaferri, G., & Fossati, G. 2001, A&A, 375, 739 [NASA ADS] [CrossRef] [EDP Sciences] [Google Scholar]
- Fiorucci, M., & Tosti, G. 1996, A&AS, 116, 403 [NASA ADS] [CrossRef] [EDP Sciences] [Google Scholar]
- Fitzpatrick, E. L., & Massa, D. 1999, BAAS, 31, 4, 1238 [Google Scholar]
- Fomin, V. P., Stepanian, A. A., Lamb, R. C., et al. 1994, ApJ, 2, 137 [Google Scholar]
- Fukugita, M., Shimasaku, K., & Ichikawa, T. 1995, PASP, 107, 945 [NASA ADS] [CrossRef] [Google Scholar]
- Hillas, A. M. 1985, in Proc. of the 19th ICRC (La Jolla), 3, 445 [Google Scholar]
- Horan, D., Badran, H. M., Bond, I. H., et al. 2004, ApJ, 603, 51 [NASA ADS] [CrossRef] [Google Scholar]
- Li, T.-P., & Ma, Y.-Q. 1983, ApJ, 272, 317 [NASA ADS] [CrossRef] [Google Scholar]
- Lombardi, S., Berger, K., Colin, P., et al. 2011, in Proc. 32nd ICRC (Beijing) [arXiv:1109.6195] [Google Scholar]
- Ma, C., Arias, E. F., Eubanks, T. M., et al. 1998, AJ, 116, 516 [NASA ADS] [CrossRef] [Google Scholar]
- Mankuzhiyil, N., Ansoldi, S., Persic, M., et al. 2012, ApJ, 753, 154 [NASA ADS] [CrossRef] [Google Scholar]
- Maraschi, L., & Tavecchio, F. 2003, ApJ, 593, 667 [NASA ADS] [CrossRef] [Google Scholar]
- Mariotti, M. 2011, ATel, 3719 [Google Scholar]
- Mattox, J. R., Bertsch, D. L., Chiang, J., et al. 1996, ApJ, 461, 396 [NASA ADS] [CrossRef] [Google Scholar]
- Moralejo, A., Gaug, M., Carmona, E., et al. 2009, in Proc. 31st ICRC (Łódź) [arXiv:0907.0943] [Google Scholar]
- Nilsson, K. K., Orsi, A., Lacey, C. G., et al. 2007, A&A, 474, 385 [NASA ADS] [CrossRef] [EDP Sciences] [Google Scholar]
- Nolan, P. L., Abdo, A. A., Ackermann, M., et al. 2012 ApJ, 199, 31 [Google Scholar]
- Padovani, P., & Giommi, P. 1995, ApJ, 444, 567 [NASA ADS] [CrossRef] [Google Scholar]
- Poole, T. S., Breeveld, A. A., Page, et al. 2008, MNRAS, 383, 627 [NASA ADS] [CrossRef] [Google Scholar]
- Punch, M., Akerlof, C. W., Cawley, M. F., et al. 1992, Nature, 358, 6386, 477 [NASA ADS] [CrossRef] [Google Scholar]
- Roming, P. W. A., Kennedy, T. E., Mason, K. O., et al. 2005, Space Sci. Rev., 120, 95 [NASA ADS] [CrossRef] [Google Scholar]
- Schlegel, D. J., Finkbeiner, D. P., & Davis, M. 1998, ApJ, 500, 525 [NASA ADS] [CrossRef] [Google Scholar]
- Tavecchio, F., Maraschi, L., & Ghisellini, G., 1998, ApJ, 509, 608 [NASA ADS] [CrossRef] [Google Scholar]
- Tavecchio, F., Ghisellini, G., Ghirlanda, G., Foschini, L., & Maraschi, L. 2010, MNRAS, 401, 1570 [NASA ADS] [CrossRef] [Google Scholar]
- Tramacere, A., Massaro, E., & Taylor, A. M. 2011, ApJ, 739, 66 [NASA ADS] [CrossRef] [Google Scholar]
- Zhang, J., Liang, E. W., Zhang, S. N., & Bai, J. M. 2012, ApJ, 752, 157 [NASA ADS] [CrossRef] [Google Scholar]
All Tables
Results of Swift/XRT observations: observation date in MJD, exposure time, integral flux in the energy range 2–10 keV, photon index of a simple power law fit function, reduced χ2 with the number of degrees of freedom nd.o.f..
All Figures
|
Fig. 1 Distribution of the squared angular distance (θ2) between the source position and the reconstructed γ-ray direction for ON-source events (black points) and normalized OFF-source events (grey shaded area). The dashed line corresponds to the predefined region selected for the calculation of the significance of the detection. The respective statistics for ON and normalized OFF events are given in the figure. |
| In the text | |
|
Fig. 2 MAGIC light curve in the energy range from 200 GeV to 2 TeV. The Crab nebula flux (Aleksić et al. 2012c) scaled to 5% is shown for comparison (dashed line). The points correspond to the 14 days binned flux of 1ES 1727+502, and the error bars represent the statistical error only. The line represents the average flux during the entire observing period. The probability of a constant flux is 0.6% and the reduced χ2 with the number of degrees of freedom nd.o.f. of the fit assuming a constant flux is 10.12/2. |
| In the text | |
|
Fig. 3 Ten years light curve in the optical R-band from the Tuorla blazar monitoring program. The contribution of the host galaxy (1.25 ± 0.06 mJy) has not been subtracted. Vertical lines indicate beginning and end of the MAGIC observing window in 2011. See text for details. |
| In the text | |
|
Fig. 4 Light curve with a binning of three months of the Fermi-LAT data between 1 GeV and 300 GeV. The downward pointing arrows correspond to a 95% upper limit. The vertical lines indicate beginning and end of the MAGIC observing window in 2011. The emission is consistent with a constant flux, although a trend towards a higher flux in the last bin, partially coincident with the MAGIC observations, is evident. |
| In the text | |
|
Fig. 5 Multiwavelength spectral energy distribution fitted with a one zone synchrotron self Compton model (Maraschi & Tavecchio 2003). MAGIC observations (red butterfly), have been corrected for the extragalactic background light absorption using the model of Domínguez et al. (2011). The data used for the fit are: optical from KVA (red square), archival UV and optical from Swift/UVOT and archival X-ray from Swift/XRT (blue triangles), HE γ rays from Fermi-LAT (red triangles, three months centred around the MAGIC observing period) and VHE γ rays from MAGIC. We also show the three year LAT data (light blue triangles) and archival data (grey) from the ASI/ASDC archive (http://tools.asdc.asi.it/). |
| In the text | |
Current usage metrics show cumulative count of Article Views (full-text article views including HTML views, PDF and ePub downloads, according to the available data) and Abstracts Views on Vision4Press platform.
Data correspond to usage on the plateform after 2015. The current usage metrics is available 48-96 hours after online publication and is updated daily on week days.
Initial download of the metrics may take a while.