Fig. 4
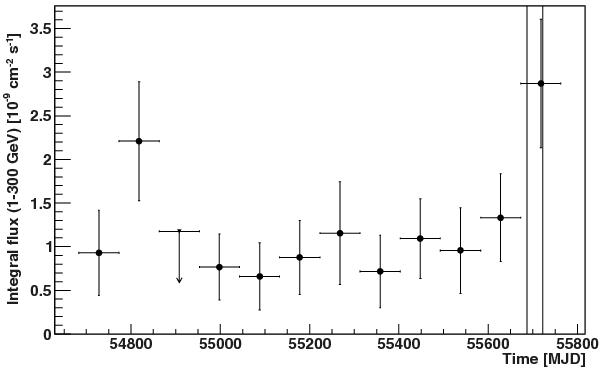
Light curve with a binning of three months of the Fermi-LAT data between 1 GeV and 300 GeV. The downward pointing arrows correspond to a 95% upper limit. The vertical lines indicate beginning and end of the MAGIC observing window in 2011. The emission is consistent with a constant flux, although a trend towards a higher flux in the last bin, partially coincident with the MAGIC observations, is evident.
Current usage metrics show cumulative count of Article Views (full-text article views including HTML views, PDF and ePub downloads, according to the available data) and Abstracts Views on Vision4Press platform.
Data correspond to usage on the plateform after 2015. The current usage metrics is available 48-96 hours after online publication and is updated daily on week days.
Initial download of the metrics may take a while.