Fig. 27
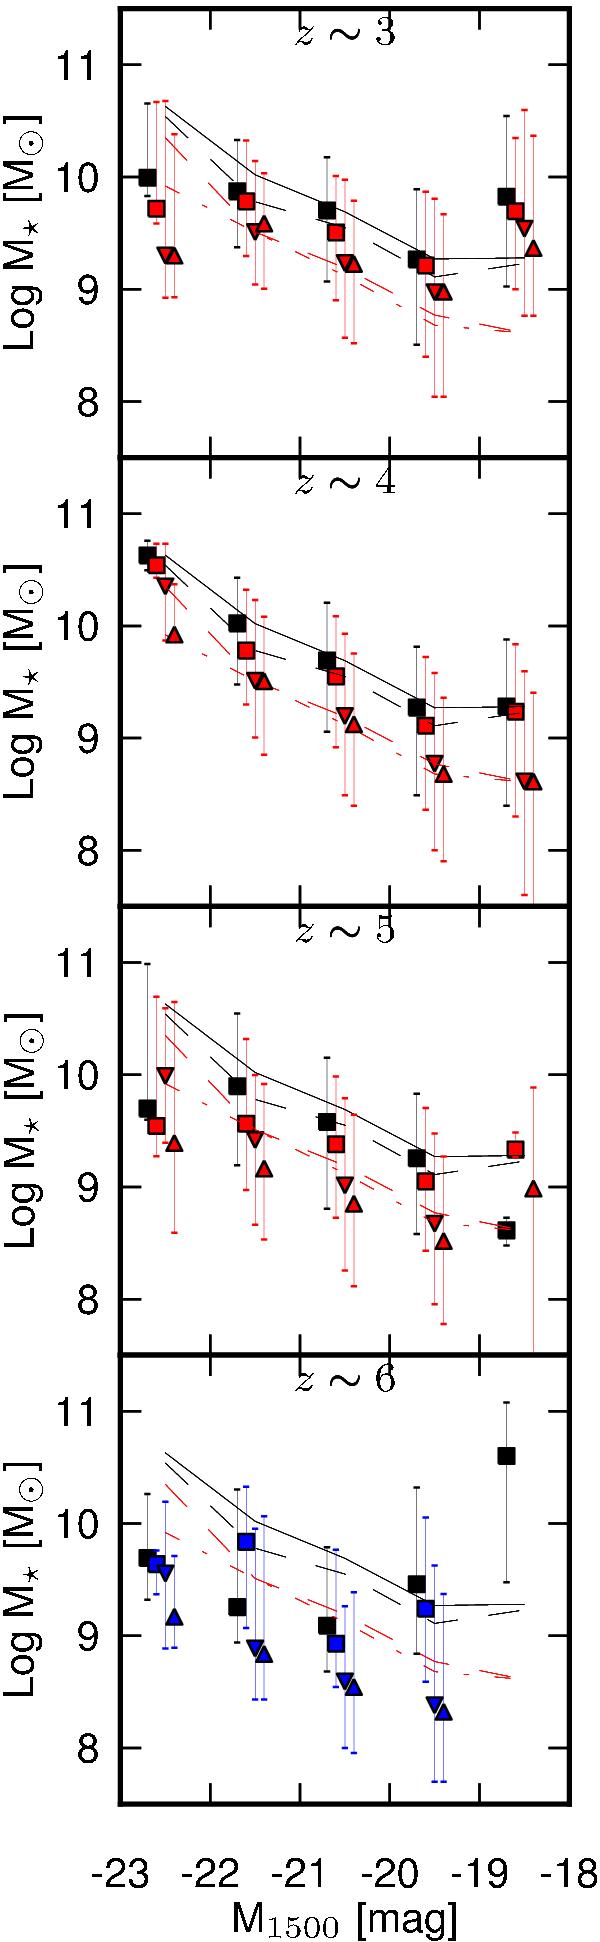
Same as Fig. 23 for stellar mass. In each panel, we plot the M⋆–M1500 found at z ~ 4 for a more convenient comparison with other studies (Stark et al. 2009; Lee et al. 2011). Solid black line: relationship for REF model, dashed black line: REF+NEB model, dashed red line: DEC+NEB, and dash-dotted red line: RIS+NEB.
Current usage metrics show cumulative count of Article Views (full-text article views including HTML views, PDF and ePub downloads, according to the available data) and Abstracts Views on Vision4Press platform.
Data correspond to usage on the plateform after 2015. The current usage metrics is available 48-96 hours after online publication and is updated daily on week days.
Initial download of the metrics may take a while.