Fig. 22
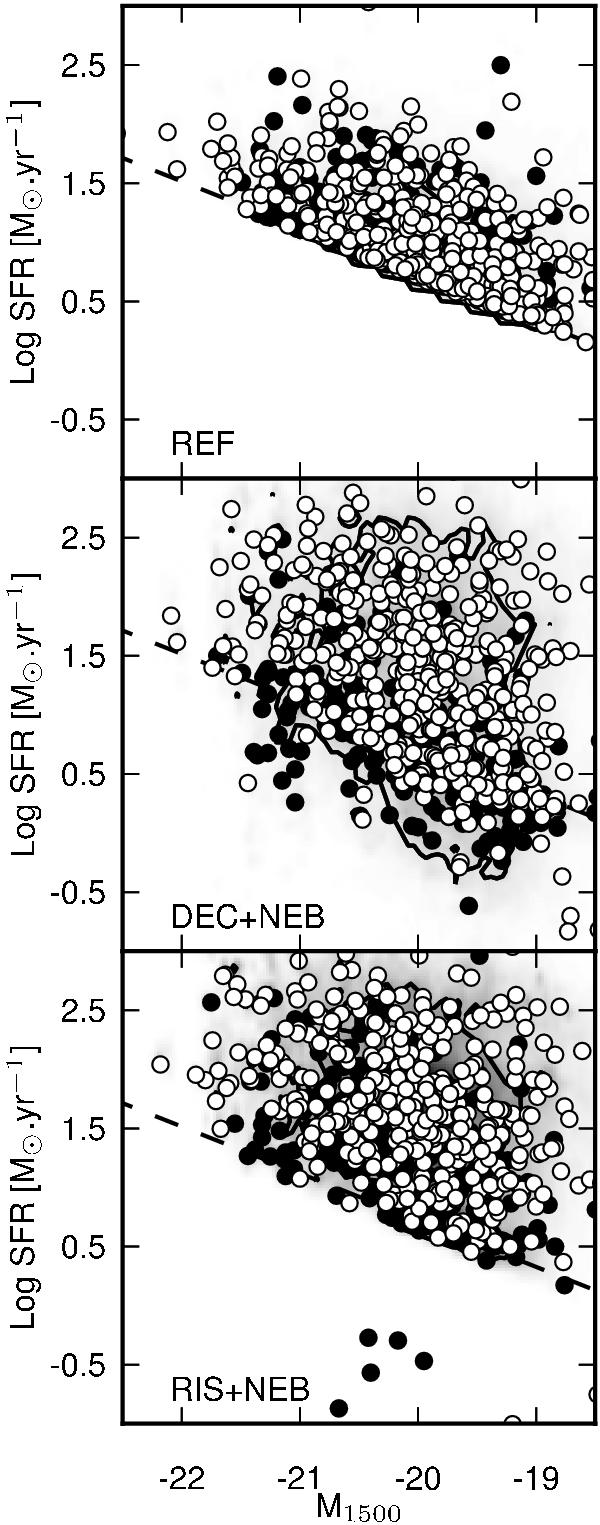
Composite probability distribution of M1500 and SFR for the REF (top), DEC+NEB (centre) and RIS+NEB model (bottom) for the sample at z ~ 4 as determined for each galaxy from our 1000 Monte Carlo simulations. The overlaid points show the median value properties for each object in the sample with black dots for “weak” nebular emitters and white dots for “strong” nebular emitters. The overlaid contours indicate the 68% integrated probabilities on the ensemble properties measured from the centroid of the distribution. The dashed line represents the Kennicutt relation (Kennicutt 1998).
Current usage metrics show cumulative count of Article Views (full-text article views including HTML views, PDF and ePub downloads, according to the available data) and Abstracts Views on Vision4Press platform.
Data correspond to usage on the plateform after 2015. The current usage metrics is available 48-96 hours after online publication and is updated daily on week days.
Initial download of the metrics may take a while.