Fig. B.1
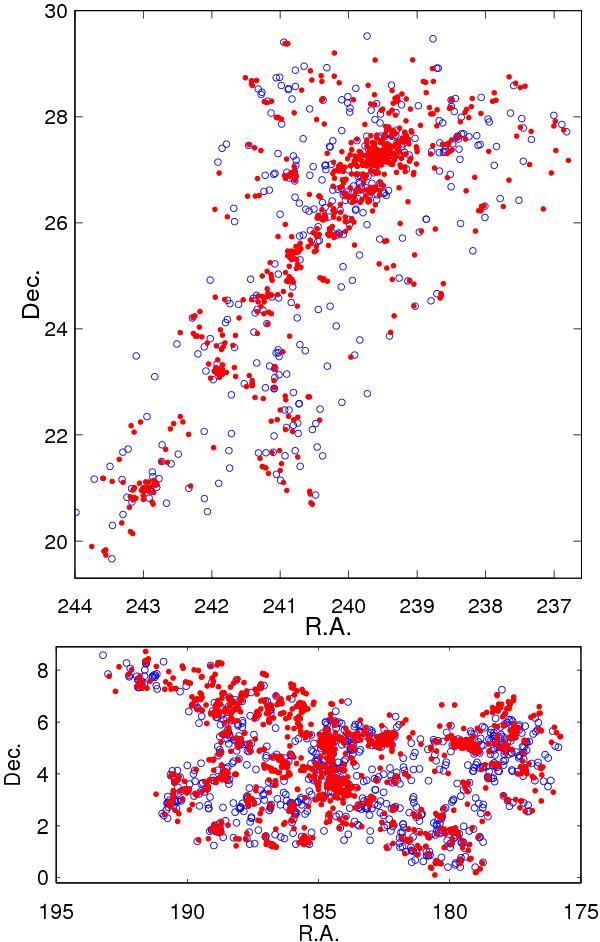
Sky distribution of galaxies for the supercluster SCl 001 of filament morphology (upper panel), and for the supercluster SCl 019 of spider morphology (lower panel). Red dots correspond to galaxies with low SFR, log SFR < −0.5, and blue dots to galaxies with high SFR, log SFR ≥ −0.5.
Current usage metrics show cumulative count of Article Views (full-text article views including HTML views, PDF and ePub downloads, according to the available data) and Abstracts Views on Vision4Press platform.
Data correspond to usage on the plateform after 2015. The current usage metrics is available 48-96 hours after online publication and is updated daily on week days.
Initial download of the metrics may take a while.