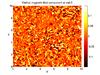
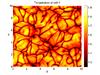
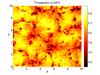
Fig. 10
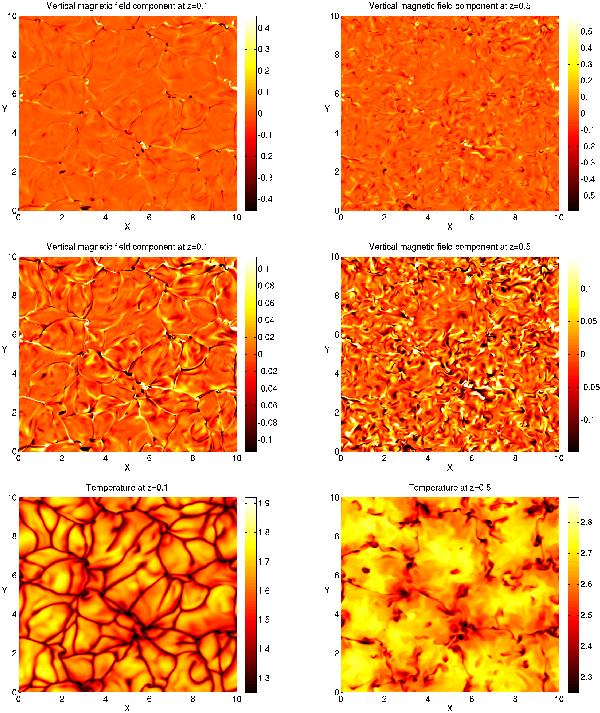
Snapshot of a statistically-steady nonlinear dynamo calculation (corresponding to case B4, with ζ0 = 0.15 – see Table 2). Top: the vertical magnetic field distribution in the horizontal planes defined by z = 0.1 (left) and z = 0.5 (right), where the colour table has been saturated at Bz = ± Beq. Middle: as above, but here the contour levels have been saturated at ± 0.25Beq to highlight some of the small-scale structure in the field distribution. Bottom: the corresponding temperature distributions for z = 0.1 (left) and z = 0.5 (right).
Current usage metrics show cumulative count of Article Views (full-text article views including HTML views, PDF and ePub downloads, according to the available data) and Abstracts Views on Vision4Press platform.
Data correspond to usage on the plateform after 2015. The current usage metrics is available 48-96 hours after online publication and is updated daily on week days.
Initial download of the metrics may take a while.