Fig. 5
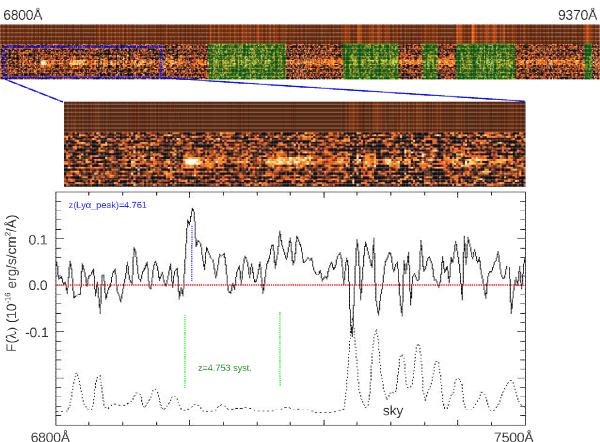
FORS2 two-dimensional spectrum from 6800 to 9400 Å (top). The shaded green rectangles mark the noisy regions affected by intense sky emission lines. A zoom on the Lyα and N v positions in the wavelength interval 6800–7500 Å (blue dotted rectangle) is shown in the middle and bottom of the figure. The wavelength of the Lyα and N v at the systemic redshift derived from the [NII]205 μm line (Nagao et al. 2012) are also reported (green vertical dotted lines).
Current usage metrics show cumulative count of Article Views (full-text article views including HTML views, PDF and ePub downloads, according to the available data) and Abstracts Views on Vision4Press platform.
Data correspond to usage on the plateform after 2015. The current usage metrics is available 48-96 hours after online publication and is updated daily on week days.
Initial download of the metrics may take a while.