Fig. 6
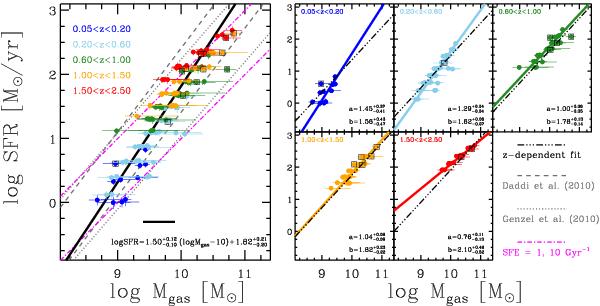
Left panel: relation between SFR and gas mass. The colour code indicates different redshift intervals, as shown by the legend in the upper left corner. The black boxes mark bins that lie in the starburst region according to Rodighiero et al. (2011). The solid thick black line is the power law fit to all data, and the best-fit relation is reported in the lower right corner. The dashed and dotted grey lines show the integrated Schmidt-Kennicutt relations fitted by Daddi et al. (2010) and Genzel et al. (2010), respectively, on normal star-forming galaxies (lower curves) and on local ULIRGs and z ~ 2 SMGs (upper curves). Curves from the literature are converted to a Salpeter IMF. Magenta dashed-dotted lines indicate constant star formation efficiencies (i.e., constant depletion times) of 1 (lower curve) and 10 (upper curve) Gyr-1. Right panels: relation between SFR and gas mass in different redshift bins, indicated in the upper left corner of each panel. Symbol styles and colours are as in the left panel. The coloured solid curves are the power law fits to the data, and the numbers in the lower right corner indicate the best-fit slope (upper) and intersection at log Mgas [M⊙] = 10 (lower) (see Eq. (7)). The dashed-triple dotted lines show the best-fit relation given in Eq. (8) calculated at the median redshift in each panel.
Current usage metrics show cumulative count of Article Views (full-text article views including HTML views, PDF and ePub downloads, according to the available data) and Abstracts Views on Vision4Press platform.
Data correspond to usage on the plateform after 2015. The current usage metrics is available 48-96 hours after online publication and is updated daily on week days.
Initial download of the metrics may take a while.