Fig. 4
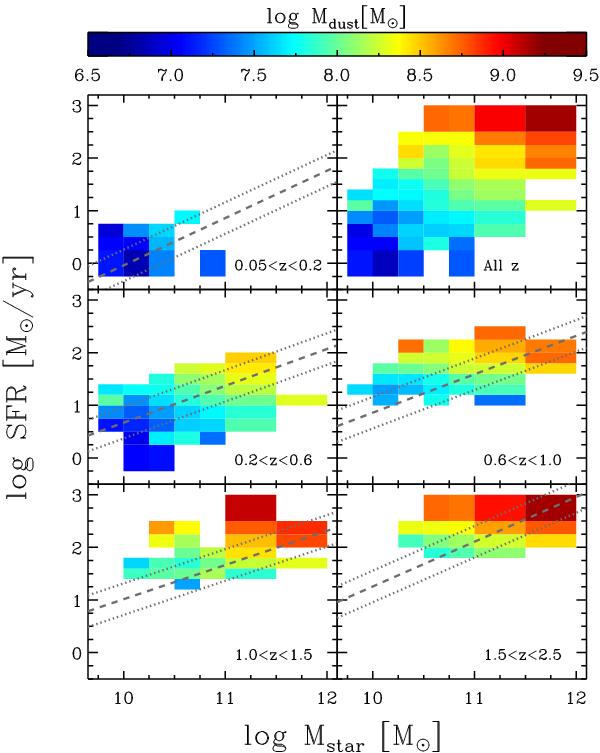
Average dust mass values, as indicated by the colour according to the colour bar, for bins of different SFR and Mstar in different redshift intervals and at all redshifts (upper right panel). Dashed lines represent MS relations of star-forming galaxies as taken from the literature; the local MS is from Peng et al. (2010) (computed using Brinchmann et al. 2004 data), rescaled to a Salpeter IMF, while the relations at higher redshifts are from Santini et al. (2009). Dotted lines represent the ± 1σ (=0.3 dex) scatter of the MS relation.
Current usage metrics show cumulative count of Article Views (full-text article views including HTML views, PDF and ePub downloads, according to the available data) and Abstracts Views on Vision4Press platform.
Data correspond to usage on the plateform after 2015. The current usage metrics is available 48-96 hours after online publication and is updated daily on week days.
Initial download of the metrics may take a while.