Fig. 3
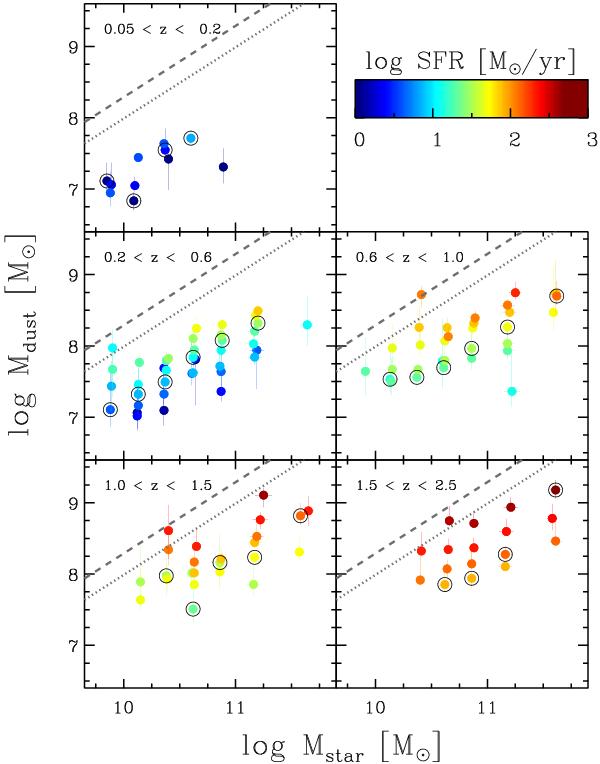
Dust mass vs. stellar mass in different redshift ranges. Symbols are colour coded according to their SFR, as shown by the colour bar. At each Mstar, black open circles mark the bin which lies closest to the MS (in each Mstar interval), and in every case within 0.3 dex from it. The correlations between Mdust and Mstar are rather flat when the data points are separated by means of their SFR. The dashed lines correspond to an amount of dust equal to the maximum metal mass  , where yZ ~ 0.014, assuming the extreme case of a condensation efficiency of 100%, while the dotted line shows the case when only 50% of the metals are depleted into dust grains (see text).
Current usage metrics show cumulative count of Article Views (full-text article views including HTML views, PDF and ePub downloads, according to the available data) and Abstracts Views on Vision4Press platform.
Data correspond to usage on the plateform after 2015. The current usage metrics is available 48-96 hours after online publication and is updated daily on week days.
Initial download of the metrics may take a while.