Fig. 13
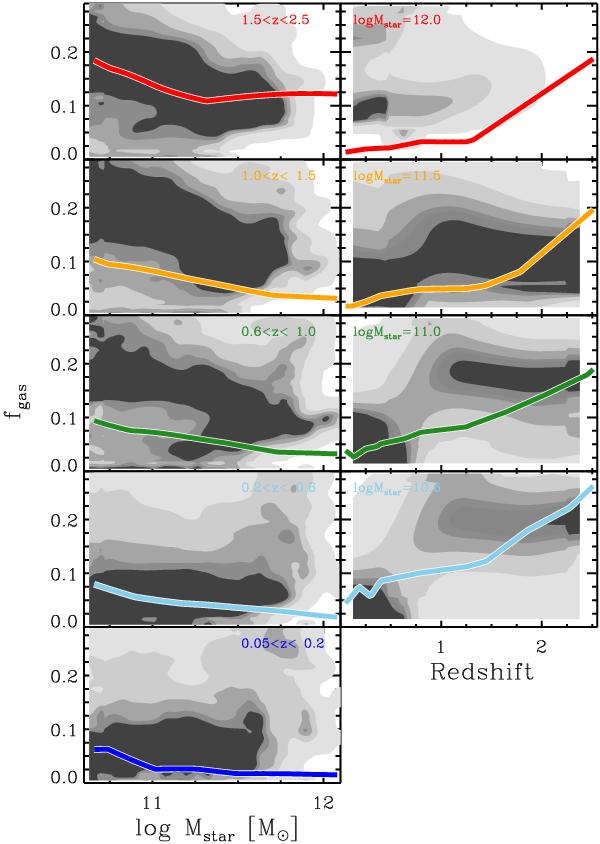
Predicted evolution of the gas fraction according to the semi-analytical model of Menci et al. (2008). The five filled contours indicate the fraction of galaxies having a given fgas at a fixed Mstar (left panels) and redshift (right panels). The trends for MS galaxies extrapolated from our observations (shown in Fig. 12) are overplotted.
Current usage metrics show cumulative count of Article Views (full-text article views including HTML views, PDF and ePub downloads, according to the available data) and Abstracts Views on Vision4Press platform.
Data correspond to usage on the plateform after 2015. The current usage metrics is available 48-96 hours after online publication and is updated daily on week days.
Initial download of the metrics may take a while.