Fig. 1
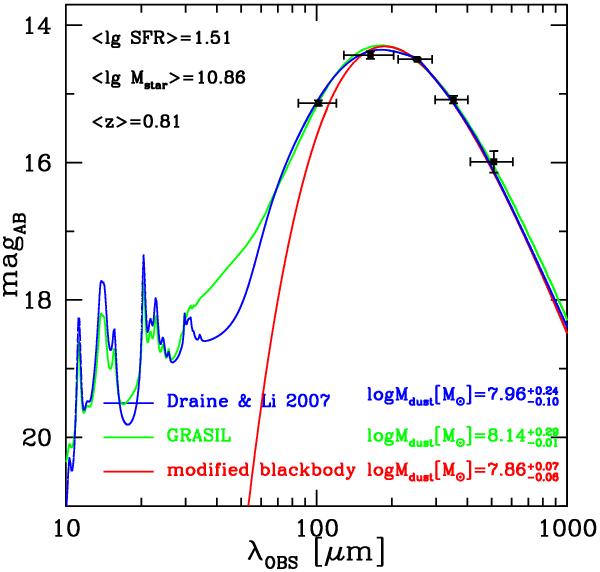
Example of the fits done to estimate the dust mass. Black symbols show stacked fluxes in the bin of the z–Mstar–SFR grid with z = [0.6,1), log Mstar [M⊙] = [10.75,11) and log SFR [M⊙/yr] = [1.4,1.6) The blue line shows the best-fit template from the library of Draine & Li (2007). For a comparison, the green and red curves show the fits with the GRASIL model and with a single-temperature modified blackbody (the latter not fitted to the shortest wavelength flux density), respectively. The dust mass inferred with the three libraries is indicated in the bottom right corner. The three libraries differ in the resulting dust masses by a roughly constant offset, but yield the same trends.
Current usage metrics show cumulative count of Article Views (full-text article views including HTML views, PDF and ePub downloads, according to the available data) and Abstracts Views on Vision4Press platform.
Data correspond to usage on the plateform after 2015. The current usage metrics is available 48-96 hours after online publication and is updated daily on week days.
Initial download of the metrics may take a while.