| Issue |
A&A
Volume 562, February 2014
|
|
|---|---|---|
| Article Number | A39 | |
| Number of page(s) | 12 | |
| Section | Galactic structure, stellar clusters and populations | |
| DOI | https://doi.org/10.1051/0004-6361/201322783 | |
| Published online | 06 February 2014 | |
Chemical abundance analysis of the old, rich open cluster Trumpler 20⋆,⋆⋆
1
ESO, Alonso de Cordova 3107, 19001
Santiago de Chile
Chile
e-mail: gcarraro@eso.org, lmonaco@eso.org, gbeccari@eso.org, hboffin@eso.org
2
Departamento de Astronomia, Universidad de
Concepción, 169
Casilla, Concepción, Chile
e-mail: svillanova@astro-udec.cl
3
Observatorio Astronómico, Universidad Nacional de
Córdoba, Laprida
854, 5000
Córdoba,
Argentina
e-mail: javier@oac.uncor.edu
Received: 2 October 2013
Accepted: 29 December 2013
Aims. Trumpler 20 is an open cluster located at low Galactic longitude, just beyond the great Carina spiral arm, and whose metallicity and fundamental parameters were very poorly known until now. As it is most likely a rare example of an old, rich open cluster – possibly a twin of NGC 7789 – it is useful to characterize it. To this end, we determine here the abundance of several elements and their ratios in a sample of stars in the clump of Trumpler 20.
Methods. We present high-resolution spectroscopy of eight clump stars. Based on their radial velocities, we identify six bona fide cluster members, and for five of them (the sixth being a fast rotator) we perform a detailed abundance analysis.
Results. We find that Trumpler 20 is slightly more metal-rich than the Sun, having [Fe/H] = +0.09 ± 0.10. The abundance ratios of α-elements are generally solar. In line with recent studies of clusters as old as Trumpler 20, Ba is overabundant compared to the Sun. Our analysis of the iron-peak elements (Cr and Ni) does not reveal anything anomalous. Based on these results, we re-estimate the cluster age to be 1.5-0.1+0.2 Gyr. Its distance to the Galactic centre turns out to be 7.3 kpc. With this distance and metallicity, Trumpler 20 fits fairly well in the metallicity gradient for the Galactic inner disc.
Conclusions. With this new study, the characterization of Trumpler 20 is now on much more solid ground. Further studies should focus on the estimate of the binary fraction and on its main sequence membership.
Key words: open clusters and associations: individual: Trumpler 20 / Hertzsprung-Russell and C-M diagrams / stars: abundances
Table 9 is available in electronic form at http://www.aanda.org
© ESO, 2014
1. Introduction
High-resolution spectroscopic data of stars in Galactic old open clusters are accumulating very rapidly. These star clusters are widely recognized as ideal tracers of the Galactic disc chemical and dynamical evolutions. A precise knowledge of the star cluster’s abundance of the various chemical elements and their ratios allows us to investigate the assembly history of the thin disc, its relationship with the thick disc and the bulge, and the presence of sub-populations, which may be indicative of past accretion events (Friel 1995; Carraro et al. 2007; Magrini et al. 2009).
Rich old open clusters are particularly interesting, since the most important evolutionary phases are better represented in the colour-magnitude diagram, and allow better comparison with theoretical models of stellar evolution. Rich clusters are not very common among old open clusters, since the typical lifetime of a star cluster is around 200 Myr (Gieles et al. 2011). Typical examples are NGC 7789 (Gim et al. 1998) and NGC 2158 (Carraro et al. 2002).
Red clump stars observed with UVES in the field of Trumpler 20.
A new member of this small family has recently been identified: Trumpler 20 (Platais et al. 2008; Seleznev et al. 2010a). This cluster possesses a conspicuous clump of He-burning stars, as do NGC 2158 and NGC 7789, but its main sequence (MS) is severely blurred by interlopers from the Galactic disc, and by some differential reddening (Platais et al. 2012). This is mostly because of its location just beyond the great Carina spiral arm, and its relatively low Galactic latitude (l = 301.5°,b = 2.2°). This has prevented a precise estimate of its age, since the location of the MS turnoff point (TO) is difficult to detect. Binary stars also play a crucial role (Carraro et al. 2010). The interest in Trumpler 20 lies mostly in its clump, as stressed by Carraro et al. (2010). Depending on its age, Trumpler 20 might actually be a twin of NGC 7789, and would therefore help to understand the details of the He-burning phases in the corresponding mass range (Girardi et al. 2000).
As described above, it has been quite difficult to estimate the cluster’s parameters, especially its age. Platais et al. (2008) and Seleznev et al. (2010) first recognized the potential interest of Trumpler 20. Platais et al. (2008) concluded that the cluster is 1.3 Gyr old, metal poor ([Fe/H] ~ −0.11 dex), and at a distance of 3.3 kpc, adopting a reddening of E(B − V) = 0.46. Seleznev et al. (2010) confirmed this set of parameters, within the large uncertainties, by assuming solar abundances and V,I photometry. Later on, Carraro et al. (2010) provided a more detailed study of Trumpler 20, based on UBVI photometry. This study, which also assumed solar metallicity, revised the cluster parameters: the reddening value was found to be significantly smaller, E(B − V) = 0.35, the distance around 3 kpc, and the age around 1.4 Gyr.
Clearly, the lack of a precise metallicity estimate from high-resolution spectra limited the study of this cluster. The recent study by Platais et al. (2012) did not solve this problem. The study concentrated on the upper MS of the cluster in an attempt to clean the TO region by using medium-resolution spectra. The upper MS, once corrected for membership and differential reddening, is then fitted by using a Z = 0.015 isochrone, which implies the same set of parameters as in Platais et al. (2008), except for the reddening, which is closer to the Carraro et al. (2010) estimate.
In an attempt to improve the cluster characterization, in this paper we present the result of a high-resolution spectroscopic observational campaign aimed at determining the abundance of many elements for the stars in the red clump of Trumpler 20. The paper is organized as follows. In Sect. 2 we present the observational material and describe how radial velocities are derived. Section 3 is devoted to the abundance analysis, while in Sect. 4 we discuss in detail the results of the analysis. Section 5 summarizes our findings.
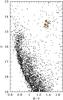 |
Fig. 1 V vs. B − V colour–magnitude diagram of Trumpler 20 from Carraro et al. (2010). Red symbols indicate bona fide members. |
Atmospheric parameters from photometry (ph) and spectroscopy (sp).
Individual abundances for Trumpler 20 members.
2. Observation and data reduction
Observations were taken in service mode on the nights of February 11 and March 3, 2012 using the multi-object fibre-fed FLAMES facility mounted at the ESO-VLT/UT2 telescope at the Paranal Observatory (Chile). Two 2400s exposures were taken simultaneously with the GIRAFFE medium-resolution spectrograph, and the red arm of the UVES high-resolution spectrograph. GIRAFFE was configured in Medusa mode in the setup HR08, which covers the wavelength range 4911–5163 Å at a resolution of R = 20 000. The UVES spectrograph was, instead, set up around a 5800 Å central wavelength, thus covering the 4760–6840 Å wavelength range and providing a resolution of R ≃ 47 000.
Here we discuss UVES data.UVES targets observed the probable red-clump targets, and are shown as open circles at the top of the cluster’s V vs. B − V colour-magnitude diagram in Fig. 1. In this figure red symbols indicate the five radial velocity members, and green the three stars for which abundance analysis was not done because they are non-members or fast rotator/binaries (see text for more details). Table 1 presents the target stars’ IDs, coordinates, and B and V photometry from Carraro et al. (2010). The data were reduced using the ESO CPL based FLAMES-UVES pipeline version 5.0.91 for extracting the individual fiber spectra.
The spectra were eventually normalized using the standard IRAF task continuum. Radial velocities were computed using the IRAF/fxcor task to cross-correlate the observed spectra with a synthetic one from the Coelho et al. (2005) library with stellar parameters Teff = 5250 K, log g = 2.5, solar metallicity, and no α-enhancement. The IRAF rvcorrect task was used to calculate the correction from geocentric velocities to heliocentric. We took the star’s radial velocity to be the average of the two epochs measured and the error to be the difference between the two values multiplied by 0.63 (small sample statistics; see Keeping 1962). For star 429 we report both measured values together with the formal fxcor uncertainties. The velocity difference between the two measurements (17.75 km s-1) is significantly higher than the estimated errors and, therefore, the star may be in a binary system. Stars 429 and 496 are probably rotating faster than the other stars. The FWHM of the cross-correlation function is about 21 km s-1 and 33 km s-1 for the two stars, respectively, to be compared to an average for the other stars of 14.2 ± 0.2 km s-1.
We exclude stars 429 and 5309, which are non-radial velocity members, and using the non-parametric jackknife resampling method (Lupton 1993) we obtain for the cluster an average radial velocity of ⟨Vr⟩ = −40.9 ± 1.2 km s-1 with a dispersion σ = 2.7 ± 1.4 km s-1.
Had we also excluded star 496, which is a fast rotator, we would have obtained ⟨Vr⟩ = −40.0 ± 0.7 km s-1, and σ = 1.4 ± 0.9 km s-1.
These values is in good agreement with that measured by Platais et al (2008, 2012), i.e. −40.8 and −40.6 km s-1, respectively.
Finally, for the abundance analysis, the two epoch rest-frame spectra obtained for each star, were averaged together. The final spectra have signal-to-noise ratios (S/N) in the range 30−50 at ~6070 Å.
Number of lines, and derived abundance σ.
3. Abundance analysis
The chemical abundances for Na, Mg, Al, Si, Ca, Ti, Cr, Fe, and Ni were obtained using the equivalent widths (EW method, as detailed in Marino et al. (2008). For C, N, O, Y, Ba, La, and Eu, whose lines are affected by blending, we used the spectrum-synthesis method. For this purpose we calculated five synthetic spectra having different abundances for the elements, and estimated the best-fitting value as the one that minimizes the rms scatter. Only lines not contaminated by telluric lines were used. ATLAS9 (Kurucz 1970) model atmospheres were used for the methods: EW and spectrum-synthesis. The initial atmospheric parameters for the model atmosphere were assumed to be those typical for a RGB star of an open cluster, i.e. Teff = 4500 K, log g = 2.5, vt = 1.20 km s-1, and [Fe/H] = 0.0. We then refined them during the abundance analysis. As a first step, atmospheric models were calculated using ATLAS9 (Kurucz 1970) using the initial estimates of Teff,log g, vt, and [Fe/H].
The value of Teff, vt, and log g were adjusted and new atmospheric models calculated in an interactive way in order to remove trends in excitation potential (EP) and equivalent width vs. abundance for Teff and vt, respectively, and to satisfy the ionization equilibrium for log g. Fe i and Fe ii were used for this purpose. The [Fe/H] value of the model was changed at each iteration according to the output of the abundance analysis. The local thermodynamic equilibrium (LTE) program MOOG (Sneden 1973) was used for the abundance analysis.
Typical internal errors are Δ(Teff) = 50 K, Δlog g = 0.2 dex, Δvt = 0.10 km s-1, and Δ[Fe/H] = 0.05 dex, respectively. To better clarify the effect of atmospheric parameters on the derived abundance, we consider star 542, and show the effect on the final abundance of changes in the temperature, gravity, and micro-turbulence velocity. The results are shown in Table 5.
Error budget analysis.
The line lists for the chemical analysis were obtained from many sources (Gratton et al. 2003, VALD & NIST2; McWilliam & Rich 1994; McWilliam 1998, SPECTRUM3, and SCAN4), and the log gf were calibrated using the solar-inverse technique and by the spectral synthesis method (see Villanova et al. 2009, for more details). For this purpose we used the high resolution, high S/N NOAO solar spectrum (Kurucz et al. 1984). The solar abundances we obtained with our line list are reported in Table 4, together with those given by Grevesse & Sauval (1998) for comparison. We emphasize the fact that all the line-lists were calibrated on the Sun, including those used for the spectral synthesis. We provide it as a long table at the bottom of the paper. In addition, the C content was obtained from the C2 system at 563.2 nm, and N from the CN lines at 634 nm.
Abundances for C, N, and O were determined all together in an interactive way in order to take into account any possible molecular coupling of these three elements. Our targets are objects evolved off the main sequence, so some evolutionary mixing is expected. This can affect the primordial C and N abundances separately, but not the total C+N+O content because these elements are transformed one into the other during the CNO cycle.
We are aware that we are deriving abundances for clump stars, but using the Sun as calibrator. Different approaches are adopted in the literature. Among the references we will use for comparison in the following, a similar approach was followed by Magrini et al. (2010), but not by Bensby et al. (2010). As a sanity check, we computed abundances for the giant star Arcturus using our line-list. Its atmospheric parameters are Teff = 4290°K, log g = 1.63, and vt = 1.29 km s-1.
The results for individual elements are shown in Table 6. One can readily see that the agreement with the literature is generally good. For instance, the differences with the recent work by McWilliam et al. (2013) are below 0.2 dex. This is valid for all species except V, for which we obtain a significant difference that our value is 0.34 dex higher than the one in McWilliam et al. (2013). A correction of this size would bring the V abundance of the cluster to a value more similar to thin disc stars (see Fig. 3). It should be noticed, however, that the Arcturus literature abundances are quite scanty for this element. Other differences with McWilliam et al. (2013) are for Ti (0.13 dex), Y (0.1 7 dex), and Ba (0.1 3 dex). Our [Y/Fe] value is right in-between the McWilliam et al. (2013) and Peterson et al. (1993) values.
Individual abundances for Arcturus.
4. Discussion
In this section, we discuss in detail the outcome of the abundance analysis and its impact on the determination of the cluster parameters.
4.1. Metallicity
Metallicity is routinely estimated using the ratio [Fe/H]. The only previous estimate of Trumpler 20 metallicity from high-resolution spectroscopy is the Platais et al. (2008) one. The spectrum of a single giant (MG 675) is used to suggest for the whole cluster metal abundance. This star is not a clump star (see Platais et al. 2008, their Fig. 2), but most probably a bright red giant. The resulting value from these authors is [Fe/H] = −0.11 ± 0.13, indicating that Trumpler 20 is slightly metal-poor with respect to the Sun, although the value is compatible with solar, within the uncertainty.
Our spectroscopic campaign focusses on the cluster red giant clump, one magnitude fainter, which we sample with eight stars (see Table 1). Six out of eight turn out to be bona fide radial velocity members. For all these stars, except for star 496, which is a fast rotator, we provide abundance analysis. We find an average [Fe/H] = 0.09 ± 0.01, with no dispersion (σ = 0.02 ± 0.01). In this case, however, 0.01 is simply the internal dispersion from the mean. Based on the analysis presented above (see Table 5), we derive a more reliable uncertainty of 0.074 when the errors on the atmospheric parameters are assumed as independent, or, in the opposite case, 0.095. We therefore adopt the value [Fe/H] = 0.09 ± 0.10.
Adopted solar abundances.
Mean Trumpler 20 abundance ratios.
While, compatible with the Platais et al. (2008) figure, our result suggests that Trumpler 20 is slightly more metal-rich than the Sun. We will discuss later the implication of this result on the cluster parameters. This value of the metal abundance is not unexpected. Located well within the solar ring, Trumpler 20 is placed comfortably in the trend of abundance as a function of galactocentric distance. According to Magrini et al. (2009), the mean metallicity of old open clusters younger than ~4 Gyr is ~0.1 dex at the galactocentric distance of Trumpler 20 (~7 kpc).
4.2. α elements
Trumpler 20 is an intermediate-age open cluster located inside the solar circle. It is therefore interesting to compare its chemical properties with stars and star clusters located in the same region of the Milky Way. The comparison of α element abundance ratios (for Mg, Ca, Ti, and Si) with old open clusters and giant stars located in the inner disc in shown in Fig. 2. Giant stars from Bensby et al. (2010) are shown as grey circles, while the inner disc old open clusters NGC 6192, NGC 6404, and NGC 6583 from Magrini et al. (2010) are indicated as filled triangles. Our clump stars are shown as filled circles. The simultaneous inspection of this figure and Table 5 allows us to suggest that, overall, Trumpler 20 follows the trend of other inner disc indicators. In detail, [Ca/Fe], [Ti/Fe], and [Si/Fe] follow giant stars of similar metallicity very closely, namely their abundance ratios are nearly solar. The only marginally deviating element is Mg, which for the same [Fe/H], appears somewhat under-abundant, but still within the scatter. This also applies to the comparison with open clusters.
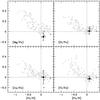 |
Fig. 2 Comparison between our α-element ratios (black solid dots) including error bars derived from Table 5, with data from old open clusters in the inner disc from Magrini et al. (2010; grey triangles) and inner disc giants from Bensby et al. (2010; light grey dots). |
4.3. Iron peak elements
We compare two iron-peak element abundance ratios (Ni and Cr) with the literature values in Fig. 3. We could not compare V with thin and thick disc stars becuase the measure is based on a single line only, but this element ratio is clearly over-abundant with respect to stars of the same metallicity. Hyperfine structure (HFS) effects can be the culprit, as amply discussed in Pancino et al. (2010). Cr (lower panel) and Ni (upper panel), nicely compare with disc stars, although the Reddy et al. (2003, 2006) samples do not contain as many stars with similar metallicity as Trumpler 20. Besides, it is reassuring to note that for these two elements we find the same trend shown by the inner disc open cluster sample from Magrini et al. (2010, grey triangles).
4.4. Neutron capture elements
A recent review of neutron capture elements in intermediate age and old open clusters was presented by Mishenina et al. (2013), particularly for barium (Ba) and yttrium (Y). This study demonstrates that Ba is routinely over-abundant with respect to the Sun, while Y is either solar or under-abundant with respect to the Sun. In Fig. 4 we compare our findings (filled black circles) for Ba and Y with thin (Reddy et al. 2003, large light-grey filled circles) and thick disc stars (Reddy et al. 2006, small light-grey filled circles), and with open cluster data from Mishenina et al. (2013, grey triangles). From this figure one can readily realize that Trumpler 20 follows the general trend. The value of [Ba/Fe] is marginally over-abundant (≈0.20), while Y is under-abundant. The same trend is visible in the sample of Pancino et al. (2010).
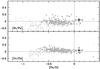 |
Fig. 3 Mean V (lower panel), Cr (middle panel), and Ni (upper panel) abundance ratios for Trumpler 20 giants (filled black circles), compared with thin disc stars (large light grey filled circles), thick disc stars (small light grey symbols), and inner disc open clusters (Magrini et al. 2010, grey triangles). |
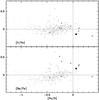 |
Fig. 4 Mean Ba (lower panel) and Y (upper panel) abundance ratios for Trumpler 20 giants (filled black circles), compared with thin disc stars (large light grey filled circles), thick disc stars (small light grey symbols), and intermediate-age and old open clusters (grey triangles). |
4.5. Revision of Trumpler 20 fundamental parameters
Carraro et al. (2010) derived the fundamental parameters of Trumpler 20, and adopted solar metallicity. With the spectroscopic estimate of the metallicity obtained in this work, we can now determine the fundamental parameters of the cluster more accurately.
The empirical metallicity [Fe/H] = +0.09 turns into the theoretical metallicity Z = 0.023 (see e.g. Carraro et al. 1999). We generated isochrones5 from the Padova suite of models (Bressan et al. 2012) for this metallicity and different ages. The best fit was obtained for an age of 1.5 Gyr, as illustrated in Fig. 5, where we also display two additional isochrones (for 1.4 and 1.7 Gyr) to illustrate fitting uncertainties. The implied reddening is 0.34 ± 0.05 mag and the apparent distance modulus m − M = 13.6 ± 0.2 mag, where uncertainties are inferred by moving the isochrones around the CMD. The fit of the turnoff region is reasonable in spite of the heavy field star contamination and the presence of a significant fraction of binary stars (Carraro et al. 2010). As mentioned already in this last study, there is a marginal difficulty in matching the mean colour of the RGB clump. This is quite common in the literature (see, e.g., Carraro & Costa 2007) and can be ascribed to a variety of effects, the most important is probably related to the isochrone transformation from the theoretical to the empirical plane and, also, the calibration of the mixing length parameter.
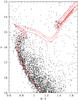 |
Fig. 5 Colour–magnitude diagram of Trumpler 20 from the photometric study of Carraro et al. (2010). Only stars within 6 arcmin from the cluster centre are considered. Over-imposed are three isochrones displaced using as reddening 0.34 mag and as apparent distance modulus 13.6 mag. The solid dashed isochrone is the best fit, for an age of 1.5 Gyr. To illustrate uncertainties in the age, we display two additional isochrones (solid red symbols) for an age of 1.4 and 1.7 Gyr. See text for details. |
Because wack any indication of abnormal absorption along the line of sight to Trumpler 20, we adopt RV = 3.1, and derive a heliocentric distance of 3.2 kpc, slightly larger than the estimate of Carraro et al. (2010). If we adopt 8.5 kpc as the Sun distance to the Galactic centre, the Galactic Cartesian coordinates for Trumpler 20 are: X = 6.6 kpc, Y = −3.0 kpc, and Z = 120 pc. As a consequence, the cluster distance to the Galactic centre RGC is 7.3 ± 0.3 kpc.
4.6. Trumpler 20 put into context
Magrini et al. (2010) studied the radial abundance gradient in the inner Galactic disc, and concluded that the inner disc gradient (i.e. inside the solar circle) is steeper than the outer disc gradient. This evidence has been recently confirmed by the new analysis of APOGEE data by Frinchaboy et al. (2013). The addition of Trumpler 20 (see Fig. 6) confirms this piece of evidence. Located at 7.3 kpc from the Galactic centre and with a mean iron abundance [Fe/H] = +0.09, Trumpler 20 fits the trend defined by the other inner disc clusters. With the inclusion of Trumpler 20 the slope of the gradient is d[Fe/H]/dR = −0.18 ± 0.08 dex/kpc. One interesting aspect to mention is that most inner disc clusters seem to preferentially locate in the fourth Galactic quadrant (270 ≤ l ≤ 360). In the sample of Magrini et al. (2010) only two clusters (NGC 6583 and NGC 6705) are located in the first Galactic quadrant. It would be interesting to extend the sample to more first quadrant clusters to search for abundance inhomogeneity or azimuthal gradients (Villanova et al. 2005; Lépine et al. 2011).
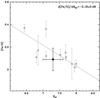 |
Fig. 6 Inner disc radial abundance gradient from Magrini et al, (2010; grey symbols) with the addition of Trumpler 20 (black circle). The dotted line is a weighted least square fit to the points, that yields −0.18 as value of the slope. |
5. Conclusions
In this paper we have presented the first high-resolution spectroscopic study of a sample of red clump stars in the rich old open cluster, Trumpler 20. The new results fully support the findings in the previous photometric study by Carraro et al. (2010).
Our results can be summarized as follows:
-
the cluster metallicity is mildly super-solar, with[Fe/H] = +0.09 ± 0.10. We did not detect any significant spread among the five bona fide radial velocity members we were able to analyse;
-
the abundance analysis reveals that Trumpler 20 is similar to other open clusters of the same age and metallicity as far as iron-peak and neutron-capture elements are concerned. The only deviation we found is for the α-element Mg, which is under-abundant with respect to the Sun. Its value is, however, consistent with the region covered by inner disc clusters or in inner disc giant stars of similar metallicity;
-
we have revised the cluster fundamental parameters. The new values for reddening and distance modulus are 0.34 ± 0.05 mag and 13.6 ± 0.2 mag, respectively. By using these figures, we derive a cluster galacto-centric distance of 7.3 kpc;
-
at this distance, and with a metallicity of [Fe/H] = +0.09, Trumpler 20 nicely matches the radial abundance gradient of the inner Galactic disc;
-
we did not detect any spread in the Na abundances in our limited sample. More data would be required, however, to firmly discard the presence of multiple stellar populations in the cluster (Platais et al. 2012 ).
Online material
Adopted line list, atomic parameters, equivalent widths (EW), and abundances (X).
Acknowledgments
J. Ahumada is grateful to ESO for supporting his visit to the Santiago premises in 2011 and 2012, where this project started. S. Villanova gratefully acknowledges the support provided by FONDECYT No. 1130721.
References
- Bensby, T., Alves-Brito, A., Oey, M. S., Yong, D., & Meléndez, J. 2010, A&A, 516, L13 [NASA ADS] [CrossRef] [EDP Sciences] [Google Scholar]
- Bressan, A., Marigo, P., Girardi, L., et al. 2012, MNRAS, 427, 127 [NASA ADS] [CrossRef] [Google Scholar]
- Carraro, G., & Costa, E. 2007, A&A, 464, 573 [NASA ADS] [CrossRef] [EDP Sciences] [Google Scholar]
- Carraro, G., Girardi, L., & Chiosi, C. 1999, MNRAS, 309, 430 [NASA ADS] [CrossRef] [Google Scholar]
- Carraro, G., Girardi, L., & Marigo, P. 2002, MNRAS, 332, 705 [NASA ADS] [CrossRef] [Google Scholar]
- Carraro, G., Geisler, D. G., Villanova, S., Frinchaboy, P. M., & Majewski, S. R. 2007, A&A, 476, 217 [NASA ADS] [CrossRef] [EDP Sciences] [Google Scholar]
- Carraro, G., Costa, E., & Ahumada, J. A. 2010, AJ, 140, 954 [NASA ADS] [CrossRef] [Google Scholar]
- Coelho, P., Barbuy, B., Meléndez, J., Schiavon, R. P., & Castilho, B. V. 2005, A&A, 443, 735 [NASA ADS] [CrossRef] [EDP Sciences] [Google Scholar]
- Friel, E. D. 1995, ARA&A, 33, 381 [NASA ADS] [CrossRef] [Google Scholar]
- Frinchaboy, P. M., Thompson, B., Jackson, K. M., et al. 2013, ApJ, 777, 1 [Google Scholar]
- Fulbright, J. P., McWilliam, A., & Rich, R. M. 2007, ApJ, 661, 1152 [NASA ADS] [CrossRef] [Google Scholar]
- Gieles, M., Heggie, D. C., & Zhao, H. 2011, MNRAS, 413, 2509 [NASA ADS] [CrossRef] [Google Scholar]
- Gim, M., Vnadenberg, D. A., Stetson, P. B., Hesser, J. E., & Zurek, D. R. 1998, PASP, 110, 1318 [NASA ADS] [CrossRef] [Google Scholar]
- Girardi, L., Mermillod, J.-C., & Carraro, G. 2000, A&A, 354, 892 [NASA ADS] [Google Scholar]
- Gratton, R. G., Carretta, E., Desidera, S., et al. 2003, A&A, 406, 131 [NASA ADS] [CrossRef] [EDP Sciences] [Google Scholar]
- Grevesse, N., & Sauval, A. J. 1998, SSRv, 85, 161 [Google Scholar]
- Keeping, E. S. 1962. Introduction to Statistical Inference (Princeton: van Nostrand) [Google Scholar]
- Kurucz, R. L. 1970, SAO Special Report (Cambridge: Smithsonian Astrophysical Observatory), 309 [Google Scholar]
- Kurucz, R. L., Furenlid, I., Brault, J., & Testerman, L. 1984, Solar flux atlas from 296 to 1300 nm [Google Scholar]
- Lépine, J. R. D., Cruz, P., Scarano, S. Jr., et al. 2011, MNRAS, 417, 698 [NASA ADS] [CrossRef] [Google Scholar]
- Lupton, R. 1993, Statistics in theory and practice (Princeton University Press) [Google Scholar]
- Magrini, L., Sestito, P., Randich, S., & Galli, D. 2009, A&A, 494, 95 [NASA ADS] [CrossRef] [EDP Sciences] [Google Scholar]
- Magrini, L., Randich, S., Zoccali, M., et al. 2010, A&A, 523, A11 [NASA ADS] [CrossRef] [EDP Sciences] [Google Scholar]
- Marino, A. F., Villanova, S., Piotto, G., et al. 2008, A&A, 490, 625 [NASA ADS] [CrossRef] [EDP Sciences] [Google Scholar]
- McWilliam, A. 1998, AJ, 115, 1640 [NASA ADS] [CrossRef] [Google Scholar]
- McWilliam, A., & Rich, R. M. 1994, ApJS, 91, 749 [NASA ADS] [CrossRef] [Google Scholar]
- McWilliam, A., Wallerstein, G., & Mottini, M. 2013, ApJ, 778, 149 [NASA ADS] [CrossRef] [Google Scholar]
- Mishenina, T., Korotin, S., Carraro, G., Kovtyukh, V. V., & Yegorova, I. A. 2013, MNRAS, 433, 1436 [NASA ADS] [CrossRef] [Google Scholar]
- Monaco, L., Villanova, S., Moni Bidin, C., et al. 2011a, A&A, 529, A90 [NASA ADS] [CrossRef] [EDP Sciences] [Google Scholar]
- Monaco, L., Saviane, I., Correnti, M., Bonifacio, P., & Geisler, D. 2011b, A&A, 525, A124 [NASA ADS] [CrossRef] [EDP Sciences] [Google Scholar]
- Pancino, E., Carrera, R., Rossetti, E., & Gallart, C. 2010, A&A, 511, A56 [NASA ADS] [CrossRef] [EDP Sciences] [Google Scholar]
- Peterson, R. C., Dal le Ore, C. M., & Kurucz, R. L. 1993, ApJ, 404, 333 [NASA ADS] [CrossRef] [Google Scholar]
- Platais, I., Melo, C., Fulbright, J. P., et al. 2008, MNRAS, 391, 1482 [NASA ADS] [CrossRef] [Google Scholar]
- Platais, I., Melo, C., Quinn, S. N., et al. 2012, ApJ, 751, L8 [NASA ADS] [CrossRef] [Google Scholar]
- Ramírez, I., & Allen de Prieto, C. 2011, ApJ, 743, 13 [NASA ADS] [CrossRef] [Google Scholar]
- Reddy, B. E., Tomkin, J., Lambert, D. L., & Allen de Prieto, C. 2003, MNRAS, 340, 304 [NASA ADS] [CrossRef] [Google Scholar]
- Reddy, B. E., Lambert, D. L., & Allen de Prieto, C. 2006, MNRAS, 367, 1329 [NASA ADS] [CrossRef] [Google Scholar]
- Seleznev, A., Carraro, G., Costa, E., & Loktin, A. 2010, New Astron., 15, 61 [NASA ADS] [CrossRef] [Google Scholar]
- Smith, V. V., Suntzeff, N. B., Cunha, K., et al. 2000, AJ, 119, 1239 [NASA ADS] [CrossRef] [Google Scholar]
- Sneden, C. 1973, ApJ, 184, 839 [NASA ADS] [CrossRef] [Google Scholar]
- Villanova, S., & Geisler, D. 2011, A&A, 535, A31 [NASA ADS] [CrossRef] [EDP Sciences] [Google Scholar]
- Villanova, S., Carraro, G., Bresolin, F., & Patat, F. 2006, AJ, 130, 652 [Google Scholar]
- Villanova, S., Carraro, G., & Saviane, I. 2009, A&A, 504, 845 [NASA ADS] [CrossRef] [EDP Sciences] [Google Scholar]
- Worley, C. C., Cottrell, P. L., Freeman, K. C., & Wylie-de Boer, E. C. 2000, MNRAS, 400, 1039 [Google Scholar]
All Tables
Adopted line list, atomic parameters, equivalent widths (EW), and abundances (X).
All Figures
|
Fig. 1 V vs. B − V colour–magnitude diagram of Trumpler 20 from Carraro et al. (2010). Red symbols indicate bona fide members. |
| In the text | |
|
Fig. 2 Comparison between our α-element ratios (black solid dots) including error bars derived from Table 5, with data from old open clusters in the inner disc from Magrini et al. (2010; grey triangles) and inner disc giants from Bensby et al. (2010; light grey dots). |
| In the text | |
|
Fig. 3 Mean V (lower panel), Cr (middle panel), and Ni (upper panel) abundance ratios for Trumpler 20 giants (filled black circles), compared with thin disc stars (large light grey filled circles), thick disc stars (small light grey symbols), and inner disc open clusters (Magrini et al. 2010, grey triangles). |
| In the text | |
|
Fig. 4 Mean Ba (lower panel) and Y (upper panel) abundance ratios for Trumpler 20 giants (filled black circles), compared with thin disc stars (large light grey filled circles), thick disc stars (small light grey symbols), and intermediate-age and old open clusters (grey triangles). |
| In the text | |
|
Fig. 5 Colour–magnitude diagram of Trumpler 20 from the photometric study of Carraro et al. (2010). Only stars within 6 arcmin from the cluster centre are considered. Over-imposed are three isochrones displaced using as reddening 0.34 mag and as apparent distance modulus 13.6 mag. The solid dashed isochrone is the best fit, for an age of 1.5 Gyr. To illustrate uncertainties in the age, we display two additional isochrones (solid red symbols) for an age of 1.4 and 1.7 Gyr. See text for details. |
| In the text | |
|
Fig. 6 Inner disc radial abundance gradient from Magrini et al, (2010; grey symbols) with the addition of Trumpler 20 (black circle). The dotted line is a weighted least square fit to the points, that yields −0.18 as value of the slope. |
| In the text | |
Current usage metrics show cumulative count of Article Views (full-text article views including HTML views, PDF and ePub downloads, according to the available data) and Abstracts Views on Vision4Press platform.
Data correspond to usage on the plateform after 2015. The current usage metrics is available 48-96 hours after online publication and is updated daily on week days.
Initial download of the metrics may take a while.