Fig. 5
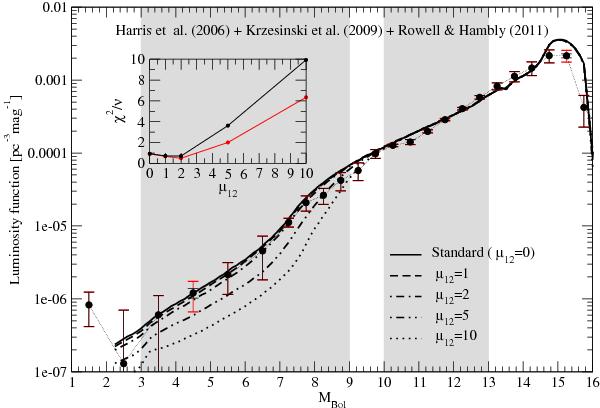
Comparison of our theoretical WDLFs constructed under the assumption of different values of μ12 with the unified WDLF constructed merging the WDLFs derived by Harris et al. (2006), Krzesinski et al. (2009), and Rowell & Hambly (2011). Red error bars correspond to those derived as σi = Max [σi,Uni,σi,SSS,σi,SDSS]. See Sect. 4 for details. The inset shows the value of the χ2 per degree of freedom ν of the χ2-test for the two different sets of error bars. Gray areas indicate the magnitude ranges used for the χ2-test (3 < MBol < 9) and for the normalization procedure (10 < MBol < 13).
Current usage metrics show cumulative count of Article Views (full-text article views including HTML views, PDF and ePub downloads, according to the available data) and Abstracts Views on Vision4Press platform.
Data correspond to usage on the plateform after 2015. The current usage metrics is available 48-96 hours after online publication and is updated daily on week days.
Initial download of the metrics may take a while.