Fig. 13
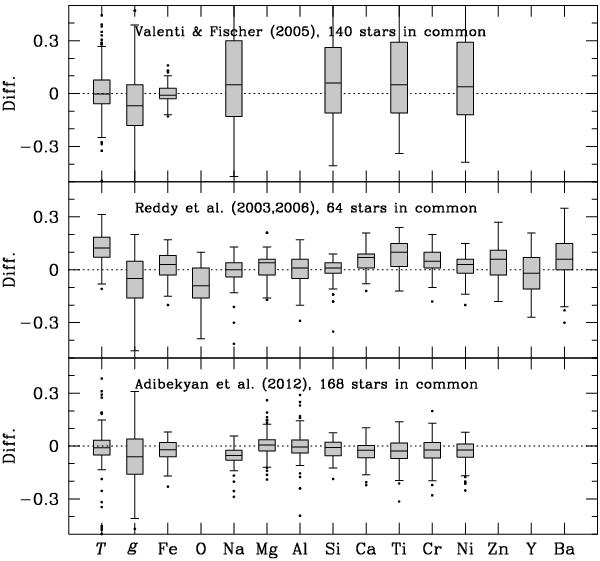
Comparison of abundances ([X/H]) for stars in common between this study and those of Valenti & Fischer (2005), Reddy et al. (2003, 2006), and Adibekyan et al. (2012). The elements (X) are indicated on the abscissa. The two left-most boxes in each panel show the Teff (denoted by T) and log g (denoted by g) comparisons. Please note that the scale on the ordinate for the temperature should be multiplied by a factor 100. The differences are given as our values minus their values, and the differences are also listed in Table 3. In the boxplots the central horizontal line represents the median value. The lower and upper quartiles are represented by the outer edges of the boxes, i.e. the box encloses 50% of the sample. The whiskers extend to the farthest data point that lies within 1.5 times the inter-quartile distance. Those stars that do not fall within the reach of the whiskers are regarded as outliers and are marked by dots.
Current usage metrics show cumulative count of Article Views (full-text article views including HTML views, PDF and ePub downloads, according to the available data) and Abstracts Views on Vision4Press platform.
Data correspond to usage on the plateform after 2015. The current usage metrics is available 48-96 hours after online publication and is updated daily on week days.
Initial download of the metrics may take a while.