Fig. 4
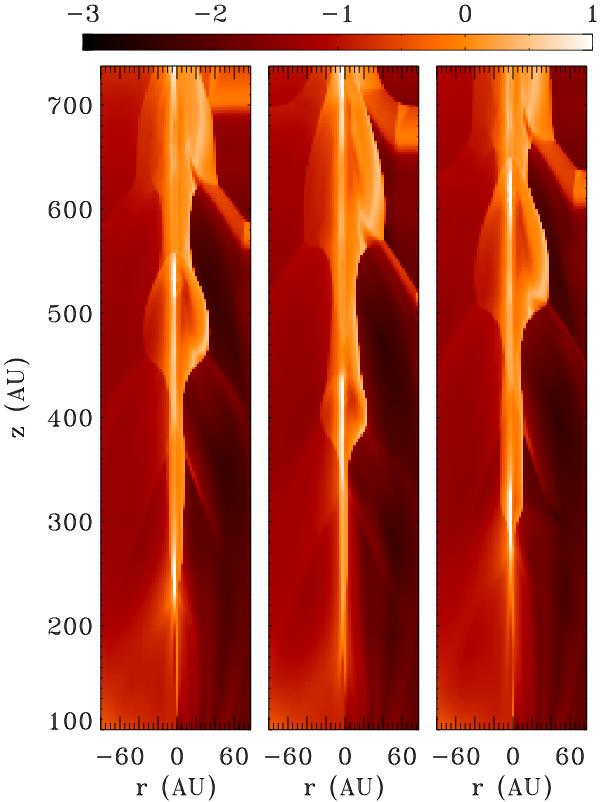
Logarithmic maps of the density in normalized units of 104 cm-3 (left axis of each panel), and the temperature in 104 K (right axis of each panel), for the model employing the MINEq cooling. From left to right, three moments of the temporal evolution are shown, i.e., 16.8, 19.2, and 21.6 years. The jet is propagating upward, and specifically, the high density region located between 200 and 300 AU in the left panel, is found between 400 and 500 AU in the middle, and between 600 and 700 AU in the right panel.
Current usage metrics show cumulative count of Article Views (full-text article views including HTML views, PDF and ePub downloads, according to the available data) and Abstracts Views on Vision4Press platform.
Data correspond to usage on the plateform after 2015. The current usage metrics is available 48-96 hours after online publication and is updated daily on week days.
Initial download of the metrics may take a while.