Free Access
Fig. 1
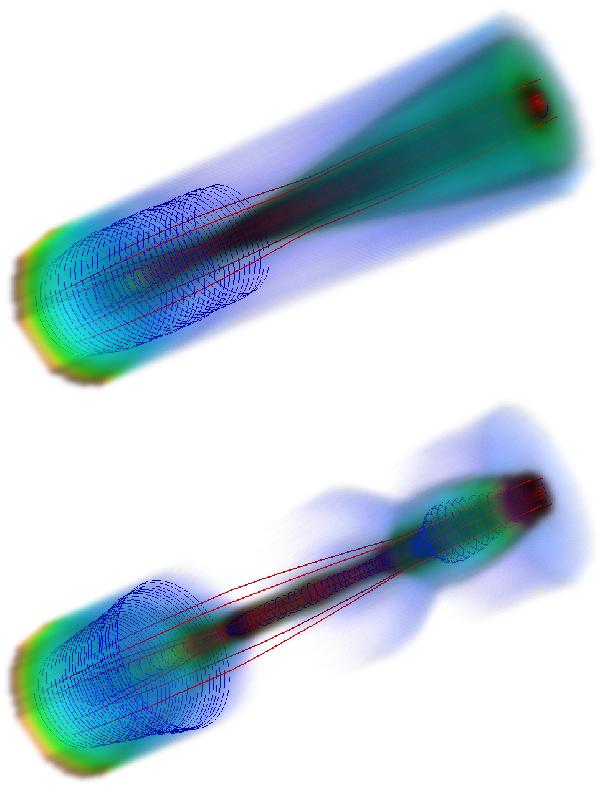
3D representation of the density distribution of the initial conditions (top) and at a later time during evolution (bottom). Blue/red corresponds to low/high density, the thin blue lines denote the magnetic field and the thick red lines the flow.
This figure is made of several images, please see below:

Current usage metrics show cumulative count of Article Views (full-text article views including HTML views, PDF and ePub downloads, according to the available data) and Abstracts Views on Vision4Press platform.
Data correspond to usage on the plateform after 2015. The current usage metrics is available 48-96 hours after online publication and is updated daily on week days.
Initial download of the metrics may take a while.