Fig. 4
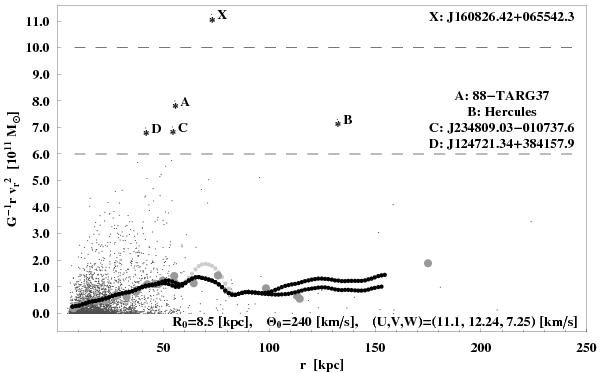
Radial velocity tracers (gray dots/black stars) and the radial velocity dispersion
(RVD) profiles (black circles) of Fig. 3 shown
on the  plane. The RVDs are curves prepared assuming that either only Leo I and X (the SI
sample) or both these two and A, B, C, D (the SII sample), are excluded (see Table
1). With all tracers included (with the
exception of Leo I), a bump structure centered at ≈70 kpc would appear (light gray
circles). The inclusion or exclusion of A, C, and D does not influence the RVDs
significantly (only a little bit close to ≈ 50 kpc), whereas the inclusion of B rises the RVD curve for
radii greater than 100 kpc. Thus, the RVD curves are mainly dependent on only two
tracers B (Hercules) and X. The large gray circles are the reference
plane. The RVDs are curves prepared assuming that either only Leo I and X (the SI
sample) or both these two and A, B, C, D (the SII sample), are excluded (see Table
1). With all tracers included (with the
exception of Leo I), a bump structure centered at ≈70 kpc would appear (light gray
circles). The inclusion or exclusion of A, C, and D does not influence the RVDs
significantly (only a little bit close to ≈ 50 kpc), whereas the inclusion of B rises the RVD curve for
radii greater than 100 kpc. Thus, the RVD curves are mainly dependent on only two
tracers B (Hercules) and X. The large gray circles are the reference
 values based on the literature (the same as in Fig. 3).
Current usage metrics show cumulative count of Article Views (full-text article views including HTML views, PDF and ePub downloads, according to the available data) and Abstracts Views on Vision4Press platform.
Data correspond to usage on the plateform after 2015. The current usage metrics is available 48-96 hours after online publication and is updated daily on week days.
Initial download of the metrics may take a while.