Fig. 1
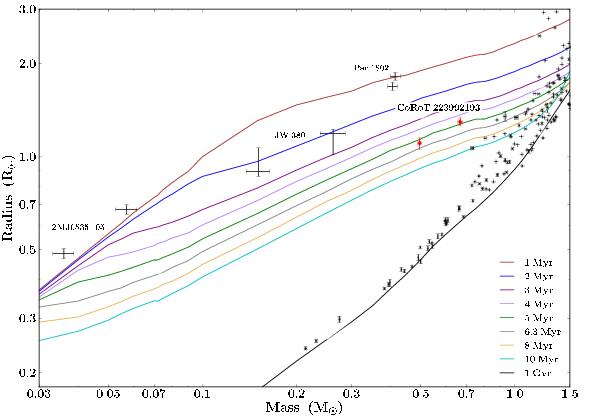
Mass–radius relation for low-mass EBs. The black points show measurements for stars with masses < 1.5 M⊙ in detached EBs1, and the lines show, from top to bottom, the theoretical isochrones of Baraffe et al. (1998, BCAH98) for 1–5, 6.3, 8, 10 Myr and 1 Gyr (brown, blue, purple, lilac, green, grey, ochre, cyan and black, respectively. Y = 0.282, [M/H] = 0, mixing length α = 1.9). The components of the new system presented in this paper are shown by the red diamonds. Note that it lies in a very sparsely populated region of the diagram, making it a valuable test of PMS stellar evolution models. For comparison, we have also labelled the three lowest mass systems known in the Orion Nebula Cluster (see Table 1 for details. For clarity, the higher mass systems are not labelled). Colour versions of all figures are available in the online article.
Current usage metrics show cumulative count of Article Views (full-text article views including HTML views, PDF and ePub downloads, according to the available data) and Abstracts Views on Vision4Press platform.
Data correspond to usage on the plateform after 2015. The current usage metrics is available 48-96 hours after online publication and is updated daily on week days.
Initial download of the metrics may take a while.