Fig. 3
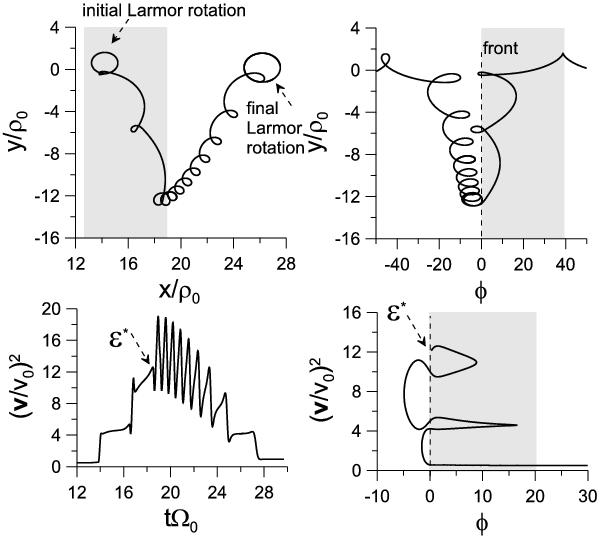
Particle trajectory and corresponding energy as a function of time. System parameters are kρ0 = 10, vφ/v0 = 1, b0 = 15. Top left panel: projection of the particle trajectory onto (x,y) plane. The region of particle acceleration before the front crossing is shown by the gray color. We also indicate the initial and final positions of the particle characterized by corresponding Larmor circles. Bottom left panel: particle energy as a function of time. The value of energy ε∗ before particle crossing of the front is indicated. Two right panels show the particle coordinate along the front and the particle energy as functions of the wave-phase. These two panels clearly demonstrate particle motion before (gray color) and after front crossing.
Current usage metrics show cumulative count of Article Views (full-text article views including HTML views, PDF and ePub downloads, according to the available data) and Abstracts Views on Vision4Press platform.
Data correspond to usage on the plateform after 2015. The current usage metrics is available 48-96 hours after online publication and is updated daily on week days.
Initial download of the metrics may take a while.