Fig. 3
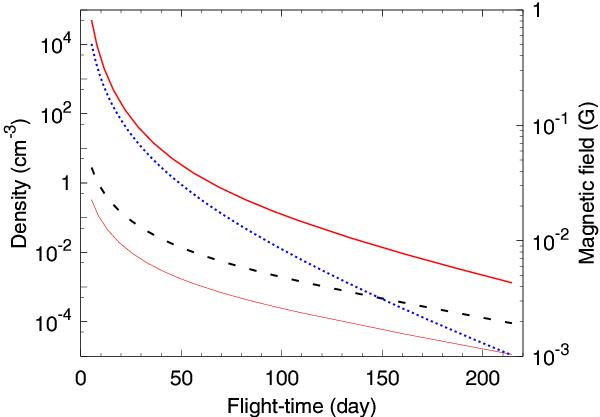
Density of the ambient medium of the SS 433 jets (thick red line) and its ratios to the isotropic wind density (thin red line) and to the jets average density (dashed black line) are plotted along the left axis in dependency on flight-time. The strength of the magnetic field in the vicinity of the jet clouds (dotted blue line) is plotted along the right axis. This figure is available in colour in the online version of this paper.
Current usage metrics show cumulative count of Article Views (full-text article views including HTML views, PDF and ePub downloads, according to the available data) and Abstracts Views on Vision4Press platform.
Data correspond to usage on the plateform after 2015. The current usage metrics is available 48-96 hours after online publication and is updated daily on week days.
Initial download of the metrics may take a while.