Fig. 1
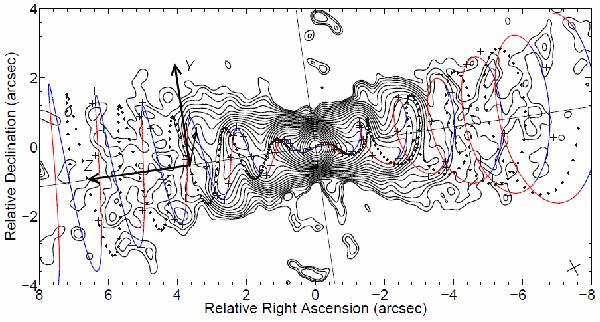
Simulated loci of the radio jets of SS 433 for the settings vj/D = 0.2581c/4.8 kpc – the dynamic jet loci are marked by pluses every 20d of a flight, and the ballistic jet loci are marked by dots every 5d beginning from a flight-time of Ppr/2 – are superimposed on the image of the jets (courtesy of Dr. D.H. Roberts). Every simulated jet trace has a length of 800 flight days. The solid helical line is the ballistic jet loci drawn by Roberts et al., (2010) for the settings vj/D = 0.2647c/5.5 kpc. Approaching/receding parts of this helix are blue/red (in the on-line version of this paper). We show the longitudinal Z and azimuthal Y axes of the rest frame of reference of the ballistic jet of our simulation, with the axes origin located at a particular jet segment. The displacement vector between this segment and the segment of the same flight-time in the dynamic jet demonstrates the deviation of the kinematics of the dynamic jets from the ballistic kinematics.
Current usage metrics show cumulative count of Article Views (full-text article views including HTML views, PDF and ePub downloads, according to the available data) and Abstracts Views on Vision4Press platform.
Data correspond to usage on the plateform after 2015. The current usage metrics is available 48-96 hours after online publication and is updated daily on week days.
Initial download of the metrics may take a while.